Fig. 3.
Download original image
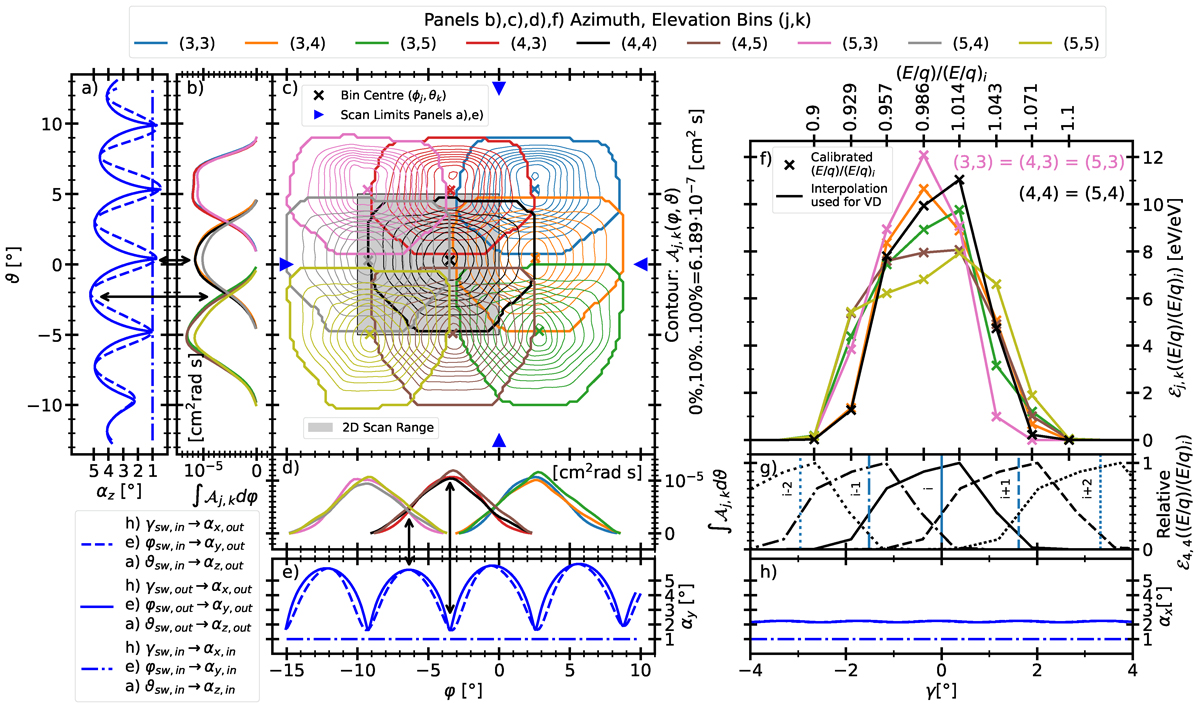
Part of the full 3D instrumental response of PAS and VPAS. Panel c) shows the response functions of nine angular bins in the centre of the PAS FoV as contour lines. The respective indices are specified in the legend at the top of the figure. Panels b), and d), give reduced 1D response functions for the same bins. Panel f) completes the 3D instrumental response with the energy response relative to the ith (E/q)i step. The blue arrows in panel c) indicate the cut along which the VPAS input angles were scanned for panels a) and e). Panel g) give relative 1D energy responses for neighbouring steps i − 2, i − 1, i, i + 1, i + 2. For VPAS the normalised differential energy responses are interpolated. Panels a), e), and h) show the angles αz, αy, and αx, respectively, over the input angles ϑsw, in, φsw, in, and γsw, in, with solid lines and over the output angles ϑsw, out, φsw, out, and γsw, out with dashed lines. The output angles are derived based on the virtual measurement, whereas the input angles refer to the properties of the simulated solar wind distribution that is measured by VPAS. The dash-dotted lines indicate the respective input angle. Black arrows mark one maximum and one minimum in panels a) and e) and connect to the corresponding 1D response functions in panels b) and d). The shaded grey area in panel c) indicates the scan range used in Fig. 5.
Current usage metrics show cumulative count of Article Views (full-text article views including HTML views, PDF and ePub downloads, according to the available data) and Abstracts Views on Vision4Press platform.
Data correspond to usage on the plateform after 2015. The current usage metrics is available 48-96 hours after online publication and is updated daily on week days.
Initial download of the metrics may take a while.