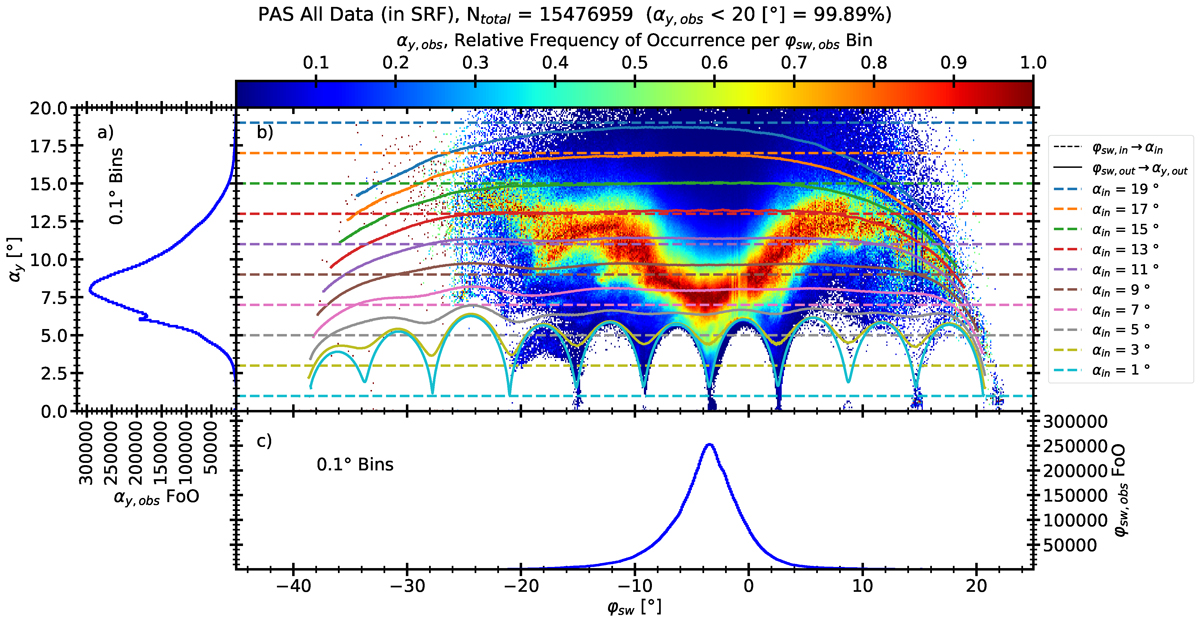
Fig. 4.
Download original image
Two-dimensional histogram of observed angles, αy, obs, observed by PAS from 7 July 2020 to 30 November 2023 over the determined inflow direction, φsw, obs (valid data with a quality factor of 0 only). Each column of the 2D histogram in panel b) is normalised to its respective maximum. The bins have a fixed size of 0.1° ×0.1°. 1D histograms of the observed angles, αy, out, (Panel a) and the determined inflow directions. φsw, out, (Panel c) are based on the same bin size, respectively. In addition, panel b) includes results from VPAS. For input angles αin ∈ {1, 3, 5, 7, 9, 11, 13, 15, 17, 19}° (horizontal dashed lines), the resulting output angles αy, out are given with solid lines in the same colour. 99.89% of all Ntotal = 15 476 959 valid data with a quality factor of 0 are shown here, the remaining 0.11% have αy, obs > 20°.
Current usage metrics show cumulative count of Article Views (full-text article views including HTML views, PDF and ePub downloads, according to the available data) and Abstracts Views on Vision4Press platform.
Data correspond to usage on the plateform after 2015. The current usage metrics is available 48-96 hours after online publication and is updated daily on week days.
Initial download of the metrics may take a while.