Fig. 5.
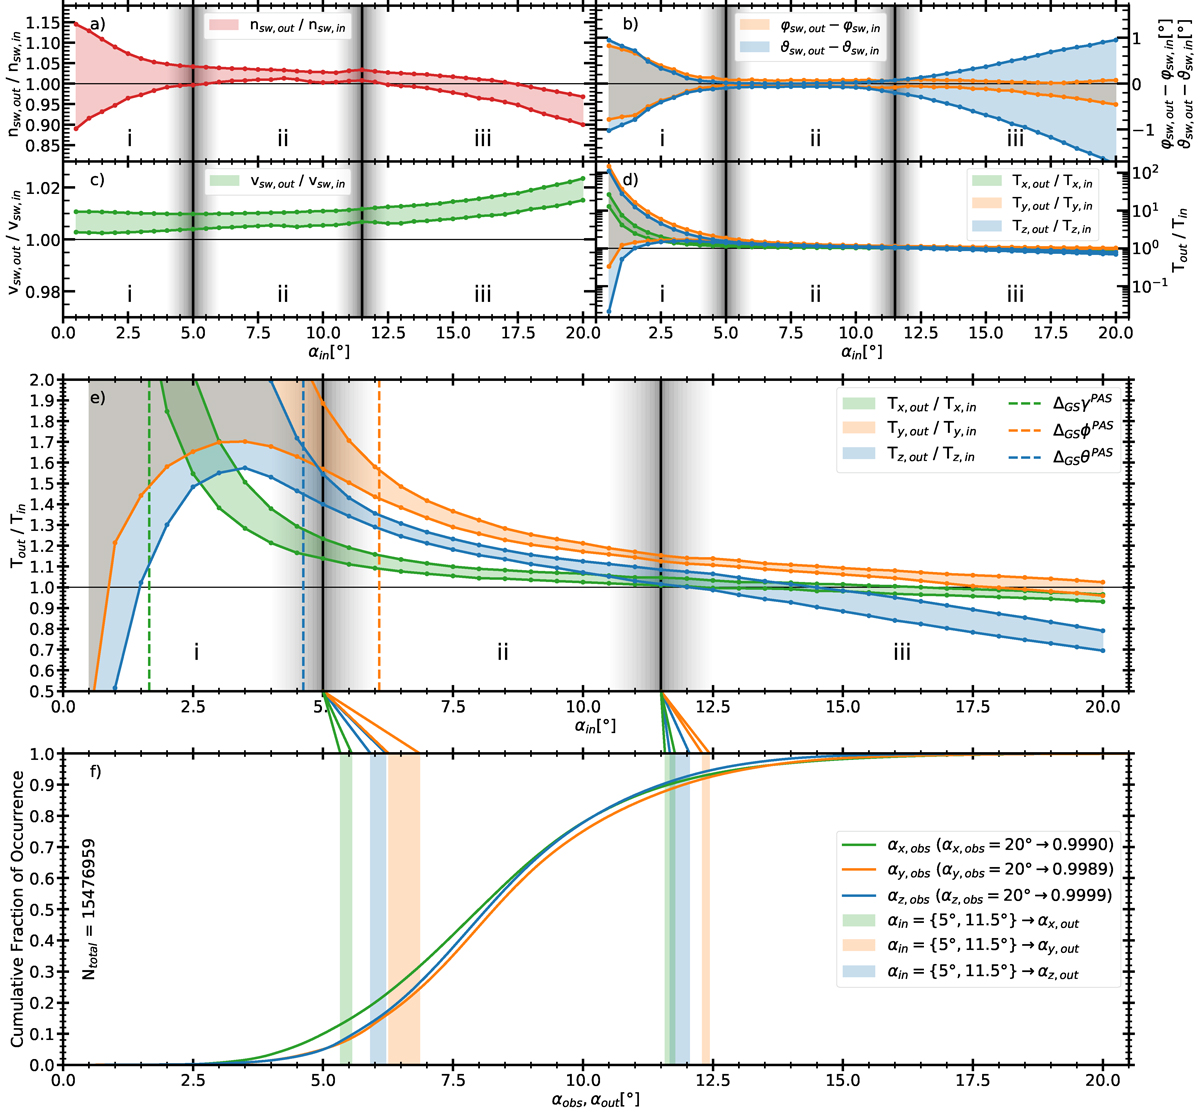
Download original image
Over- and underestimation of the 0th (Panel a)), 1st (Panels b) and c)), and 2nd moments (Panels d) and e)) over the respective input angles αin as determined by VPAS. In panels a)–e), the shaded areas represent the full range of results for all considered input configurations. Solid lines correspond to the respective minima and maxima and dots mark the tested αin. Panel e) gives a zoom-in of panel d). In panels a)–e), three regimes (i), (ii), (iii) are indicated with (fuzzy) black vertical lines. Vertical dashed coloured lines indicate the respective grid spacing, ΔGSγ, ΔGSϕ, and ΔGSθ. Panel f) shows the cumulative fraction of occurrence of the angles observed by PAS from 7 July 2020 to 30 November 2023 (valid data with a quality factor of 0 only). A total of 15 476 959 observations is included here. The range of temperature ratios at the regime boundaries in panel e) is translated with Eq. (15) into output angles αout. Shaded coloured regions in panel f) mark the resulting ranges of αout.
Current usage metrics show cumulative count of Article Views (full-text article views including HTML views, PDF and ePub downloads, according to the available data) and Abstracts Views on Vision4Press platform.
Data correspond to usage on the plateform after 2015. The current usage metrics is available 48-96 hours after online publication and is updated daily on week days.
Initial download of the metrics may take a while.