Fig. 6.
Download original image
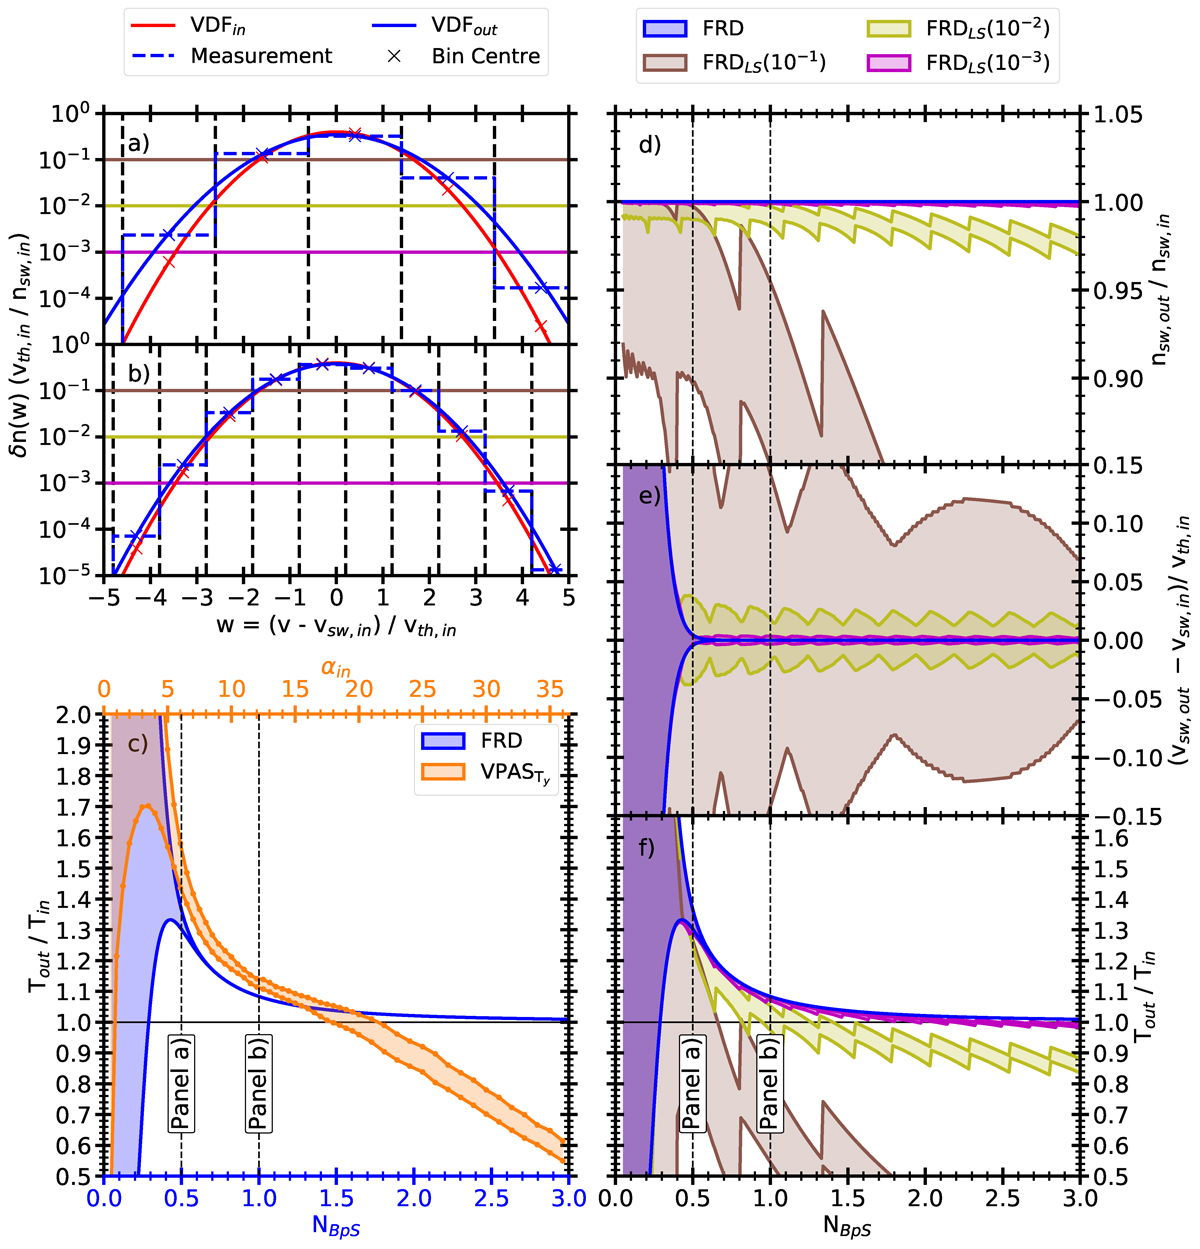
Scaled differential densities in panels a) and b). In red, a standard normal distribution with zero mean and σ = 1 is shown. Dashed black lines mark bin boundaries for two grid spacings: a) NBpS = 0.5, b) NBpS = 1. FRD results are presented in blue. Bin integrated mean values (steps) and the distribution determined from a moment calculation (line) are shown. Blue and red crosses mark the values at the bin centres. In panel c), the ratios Tout/Tin of the respective FRD over NBpS are shown in blue. The results for Ty, out/Ty, in of the VPAS are included in orange. The αin axis on the top of panel c) is scaled to approximately match the scale of NBpS. The dashed lines mark the NBpS values from panels a) and b), respectively. Coloured horizontal lines in panels a) and b) mark three effective thresholds, e.g. FRDLS(10−1) in brown. For these three thresholds and for the FRD panel d) shows the density ratio nsw, out/nsw, in, panel e) gives the velocity difference relative to the thermal speed (vsw, out − vsw, in)/vth, in, and panel e) provides the temperature ratio Tout/Tin in the same scaling as panel c) (but with a lower upper limit).
Current usage metrics show cumulative count of Article Views (full-text article views including HTML views, PDF and ePub downloads, according to the available data) and Abstracts Views on Vision4Press platform.
Data correspond to usage on the plateform after 2015. The current usage metrics is available 48-96 hours after online publication and is updated daily on week days.
Initial download of the metrics may take a while.