Fig. 4
Download original image
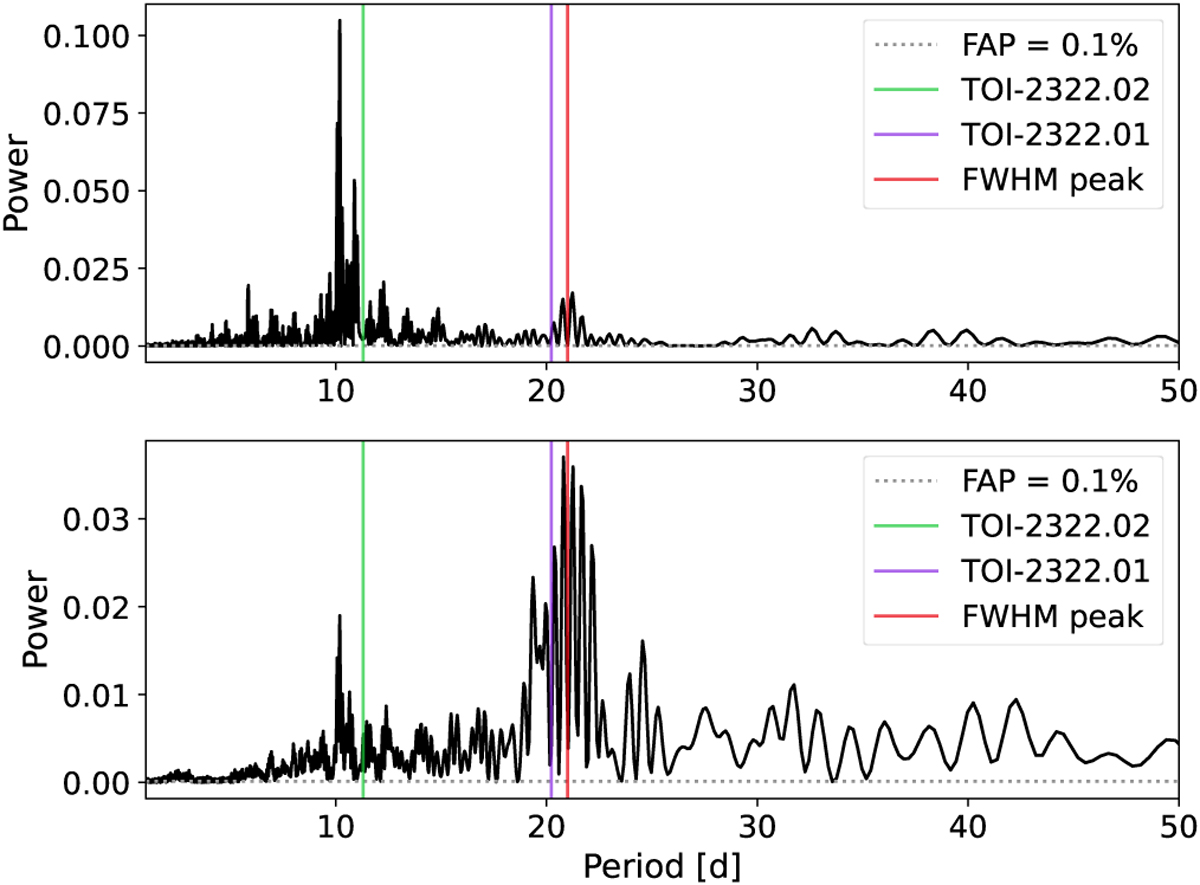
GLS periodogram of the TESS PDCSAP light curves (top) and SAP light curves (bottom). The vertical green and purple lines mark the periods of TOI-2322.02 and TOI-2322.01, respectively; the vertical red line marks the period of the highest power seen in the FWHM periodogram. The dotted horizontal grey line indicates the 0.1% FAP level.
Current usage metrics show cumulative count of Article Views (full-text article views including HTML views, PDF and ePub downloads, according to the available data) and Abstracts Views on Vision4Press platform.
Data correspond to usage on the plateform after 2015. The current usage metrics is available 48-96 hours after online publication and is updated daily on week days.
Initial download of the metrics may take a while.