Fig. 6
Download original image
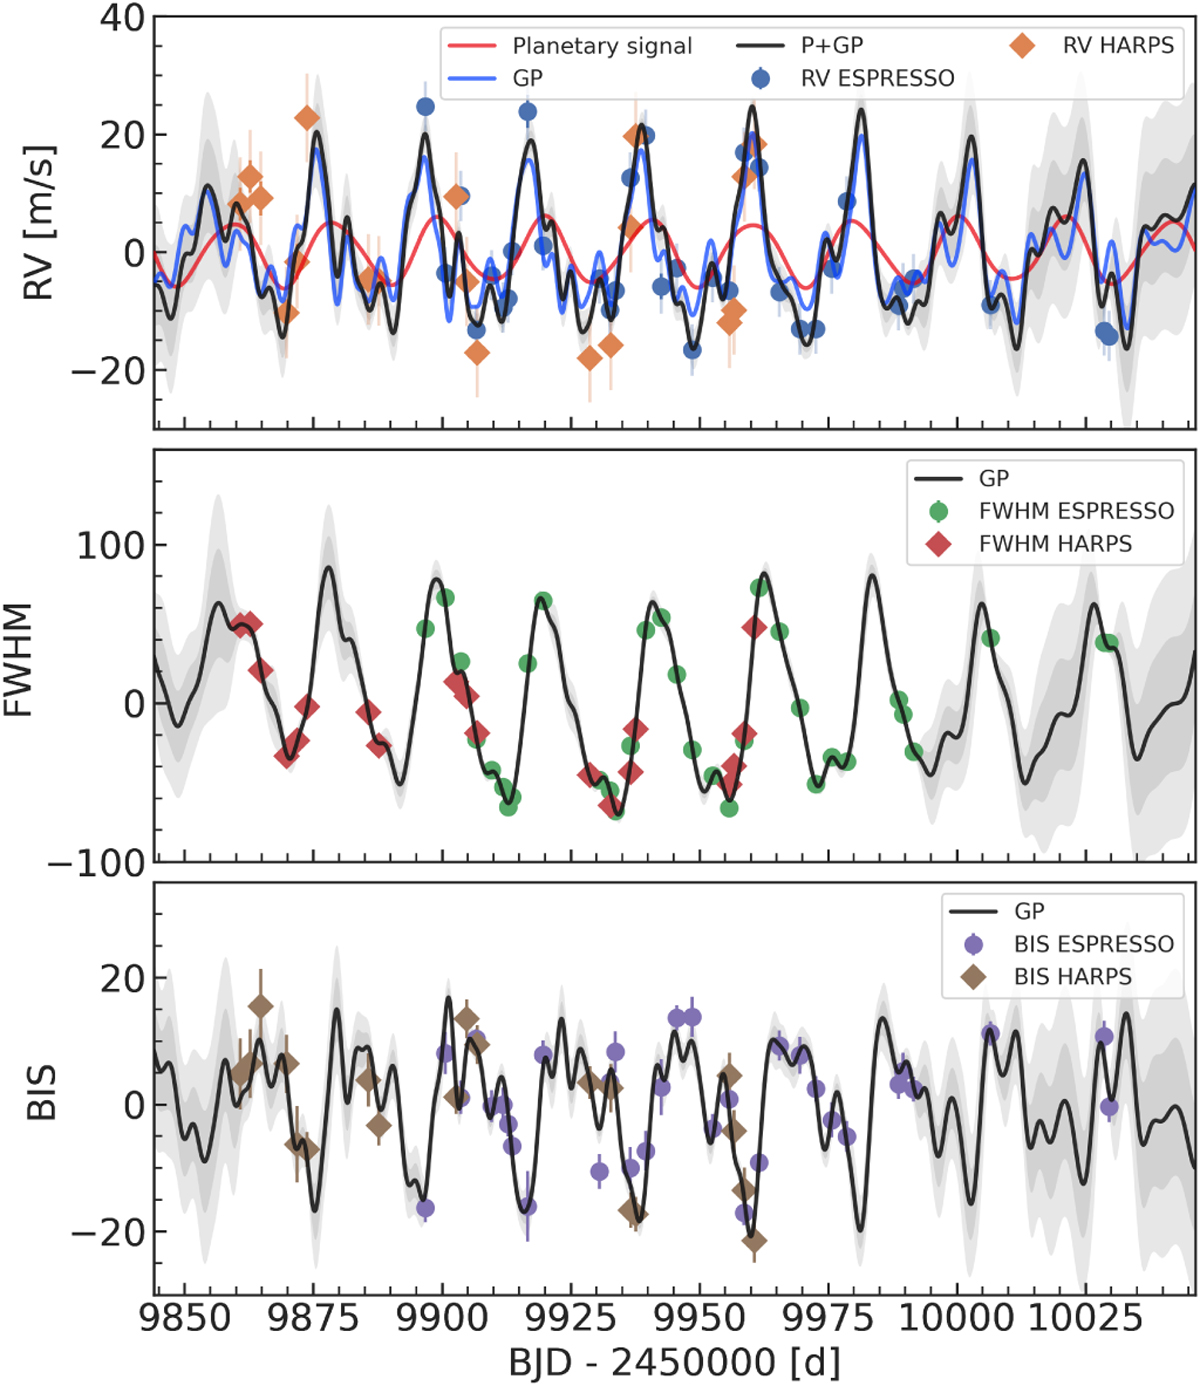
Top: ESPRESSO RVs (blue dots), HARPS RVs (orange diamonds), model components (GP: blue, Keplerian: red), and median model (black) for the pyaneti 2c model. Centre: ESPRESSO (green dots) and HARPS (and red diamonds) FWHM values and joint GP model (black). Bottom: ESPRESSO (purple dots) and HARPS (brown diamonds) BIS values and joint GP model (black). In all panels, solid error bars show the pipeline errors, semi-transparent error bars the added jitter, and dark and light grey regions the 1σ and 2σ confidence intervals. The systemic offsets have been subtracted.
Current usage metrics show cumulative count of Article Views (full-text article views including HTML views, PDF and ePub downloads, according to the available data) and Abstracts Views on Vision4Press platform.
Data correspond to usage on the plateform after 2015. The current usage metrics is available 48-96 hours after online publication and is updated daily on week days.
Initial download of the metrics may take a while.