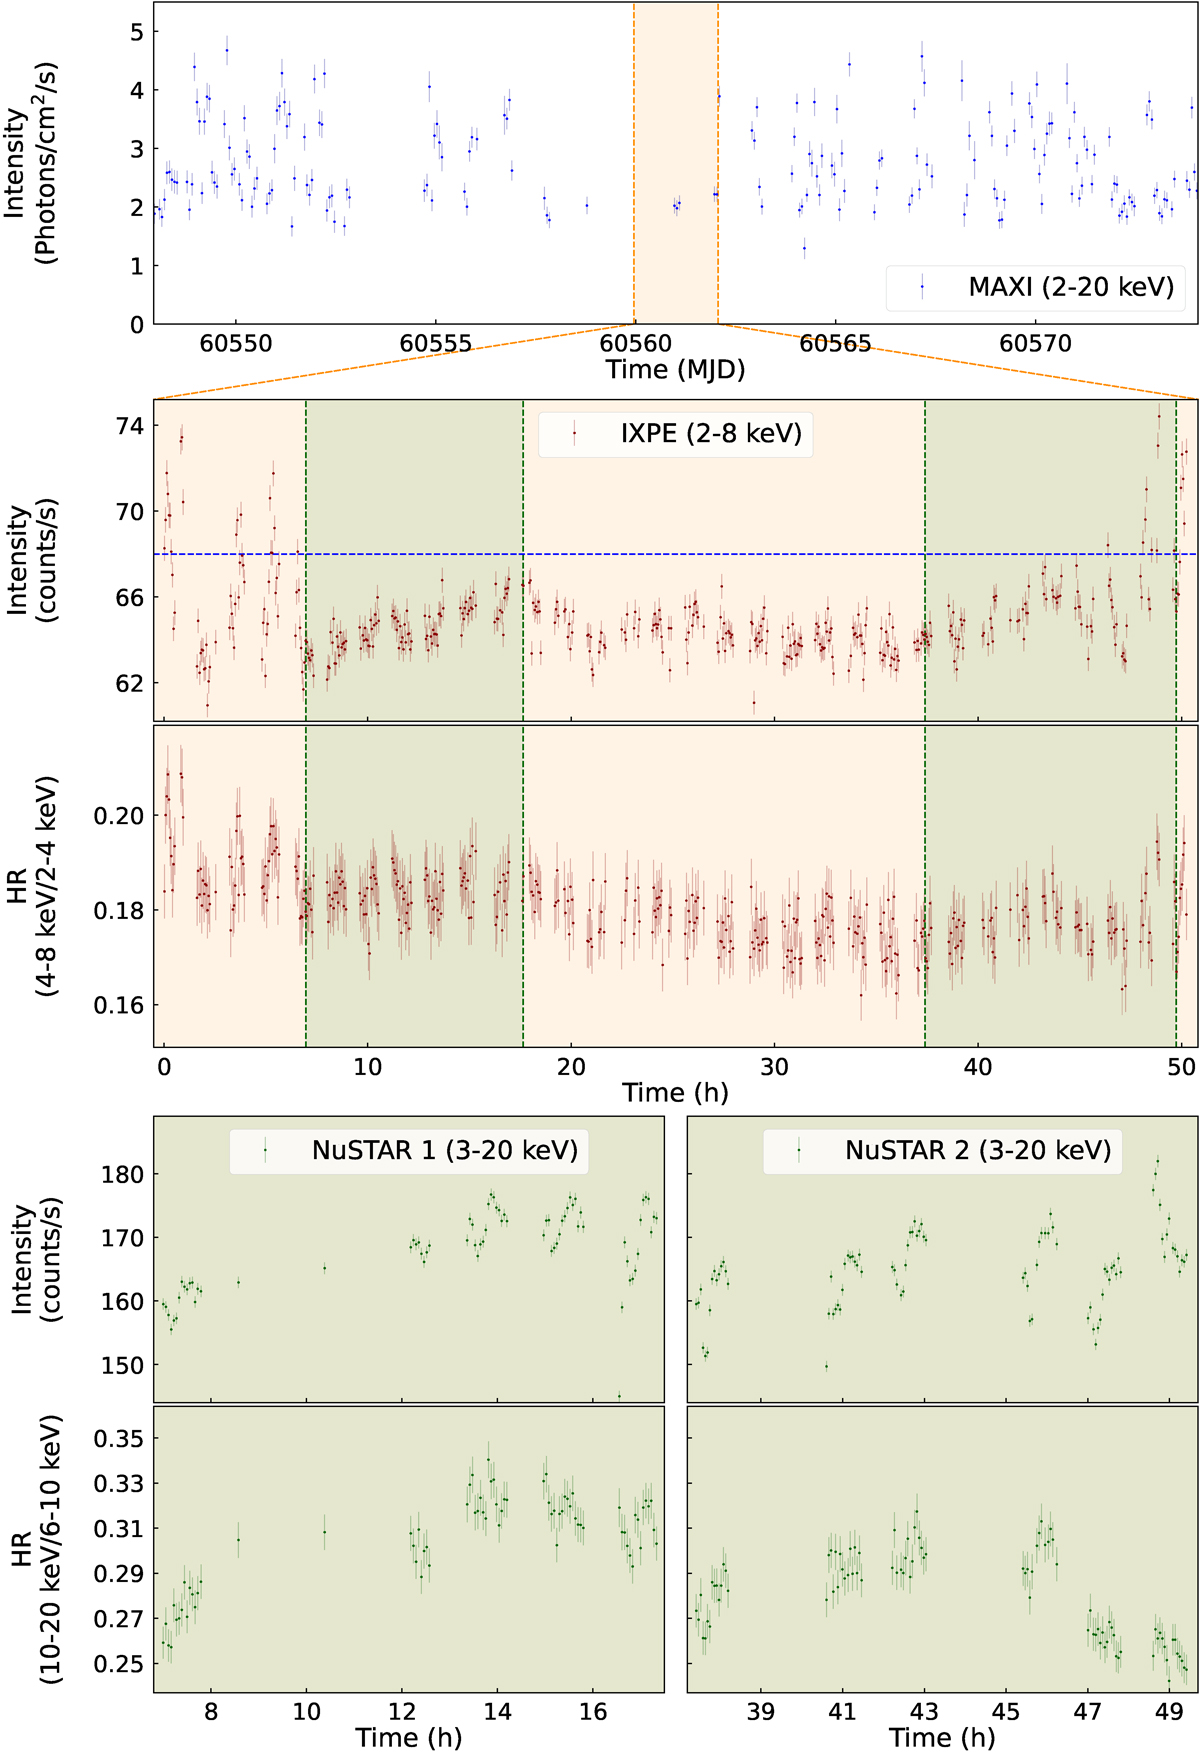
Fig. 1.
Download original image
Light curves and HRs of GX 349+2. Top panel: MAXI light curve including the period of the IXPE observation (orange-shaded region). The MAXI data were binned in 1.5 h intervals. Middle panel: IXPE light curve and HR binned in 200 s intervals. The dotted blue line identifies the threshold for the high and low flux states used in the analysis. The green-shaded regions highlight the two NuSTAR simultaneous observations. Bottom panel: NuSTAR light curves and HRs binned in 200 s intervals. The NuSTAR count rate was obtained in the 3–20 keV energy band. The time refers to hours since the start of the IXPE observation. The observation IDs are reported in Table 1.
Current usage metrics show cumulative count of Article Views (full-text article views including HTML views, PDF and ePub downloads, according to the available data) and Abstracts Views on Vision4Press platform.
Data correspond to usage on the plateform after 2015. The current usage metrics is available 48-96 hours after online publication and is updated daily on week days.
Initial download of the metrics may take a while.