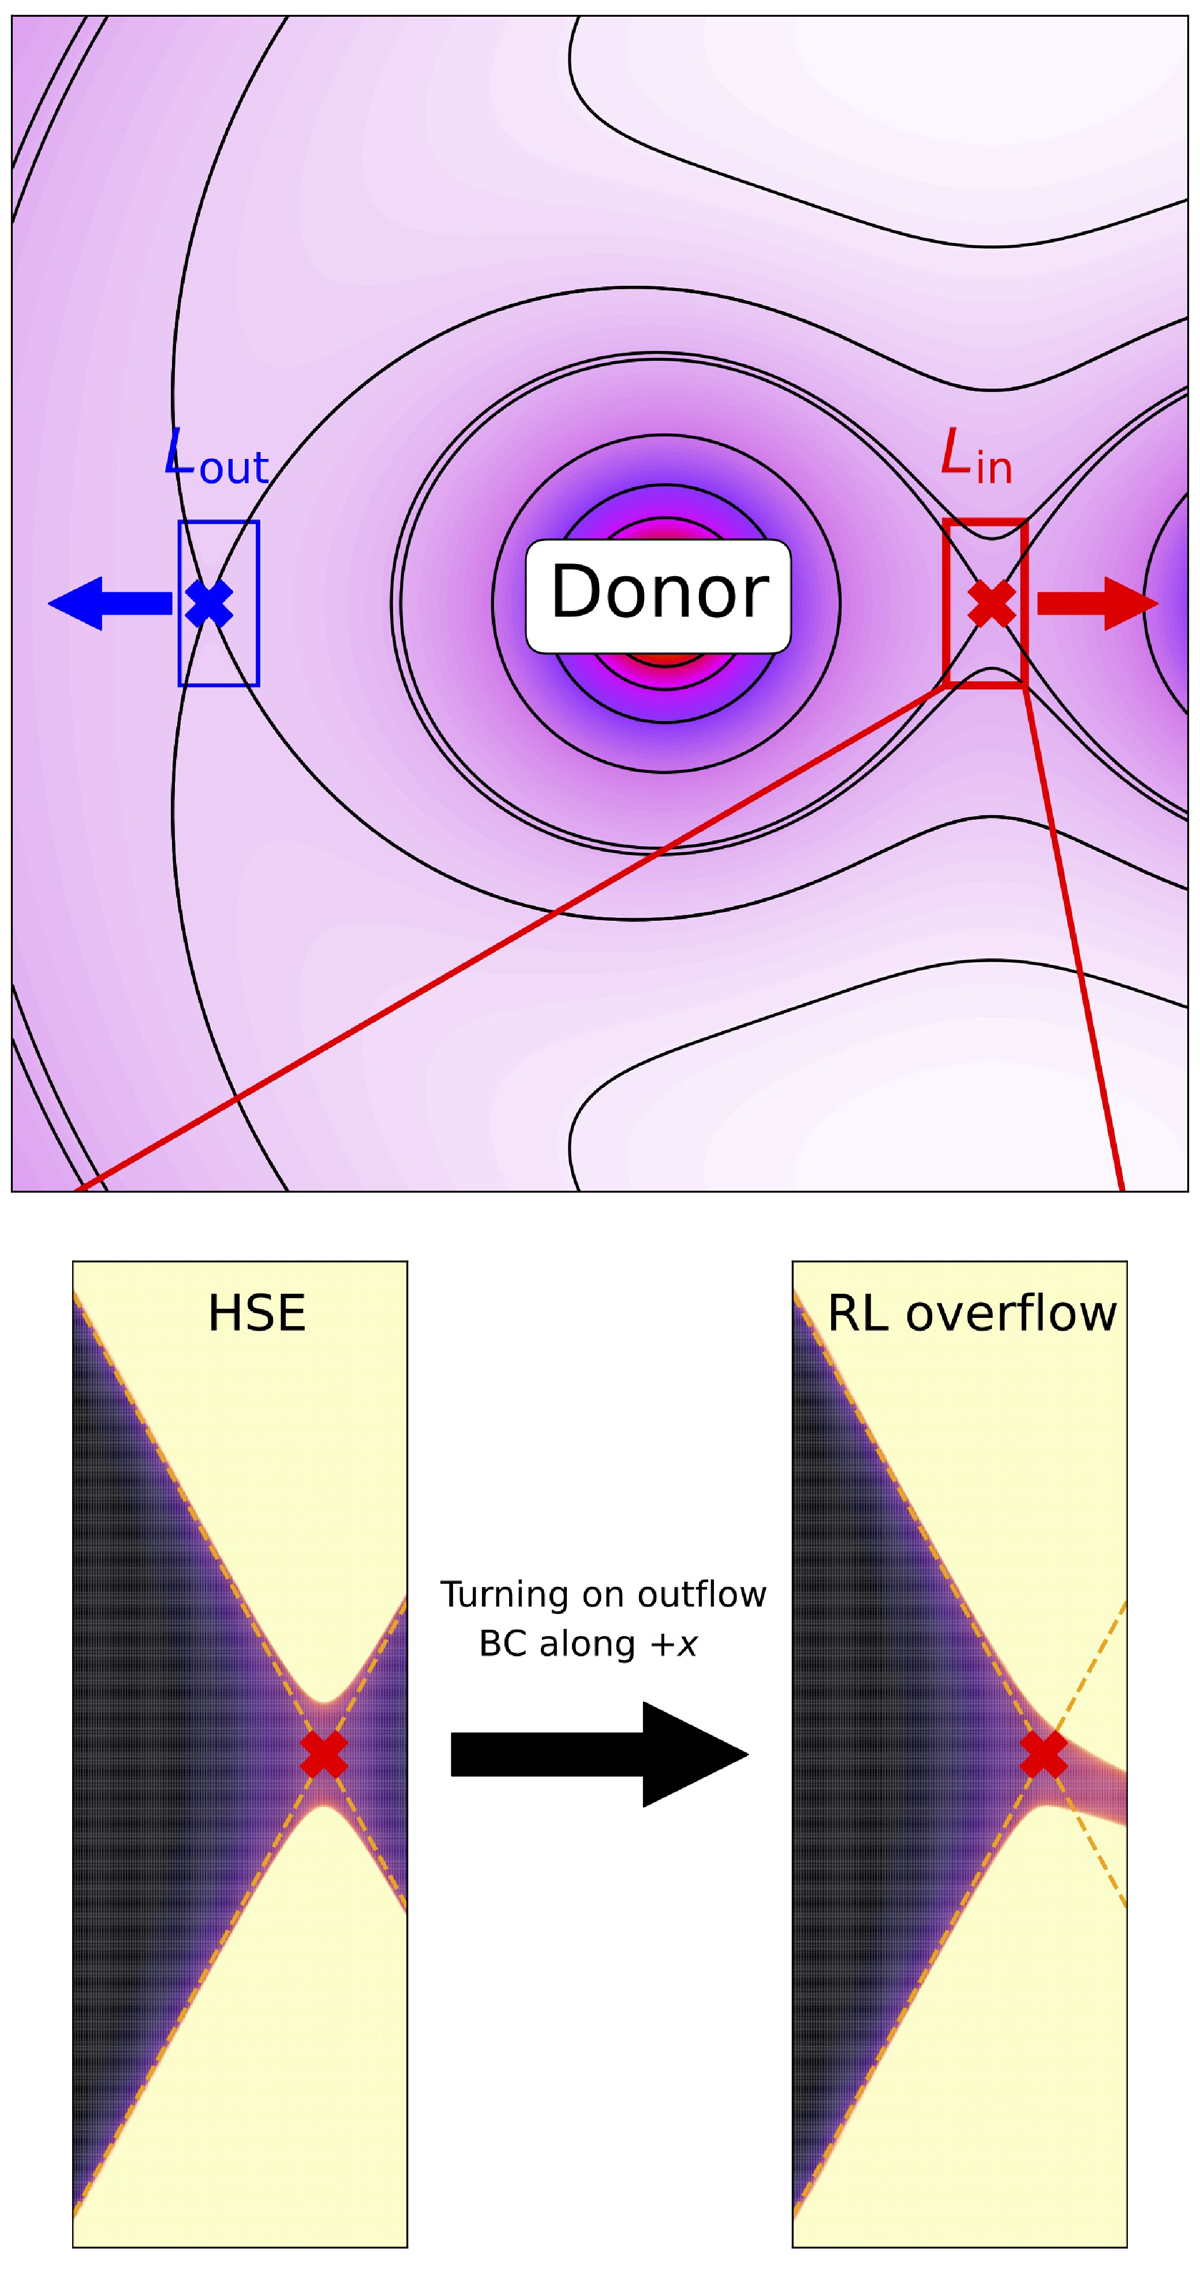
Fig. B.1.
Download original image
Schematic diagram for the location of our computational domain and transition from a hydrostatic solution to Roche lob overflow. The top panel depicts the shape of the Roche-lobe equipotential surfaces, along with the approximate locations of our computational domains (rectangles) around Lin (red cross) and Lout (blue cross). The arrows indicate the direction of overflowing gas. The diagram is drawn not to scale. The bottom panels depict the density change, with denser regions shown in darker colors, during the transition from a contact binary in hydrostatic equilibrium to overflow by imposing an outflow boundary condition (BC) along the right x boundary. The dashed diagonal orange lines depict the shape of the RL.
Current usage metrics show cumulative count of Article Views (full-text article views including HTML views, PDF and ePub downloads, according to the available data) and Abstracts Views on Vision4Press platform.
Data correspond to usage on the plateform after 2015. The current usage metrics is available 48-96 hours after online publication and is updated daily on week days.
Initial download of the metrics may take a while.