Open Access
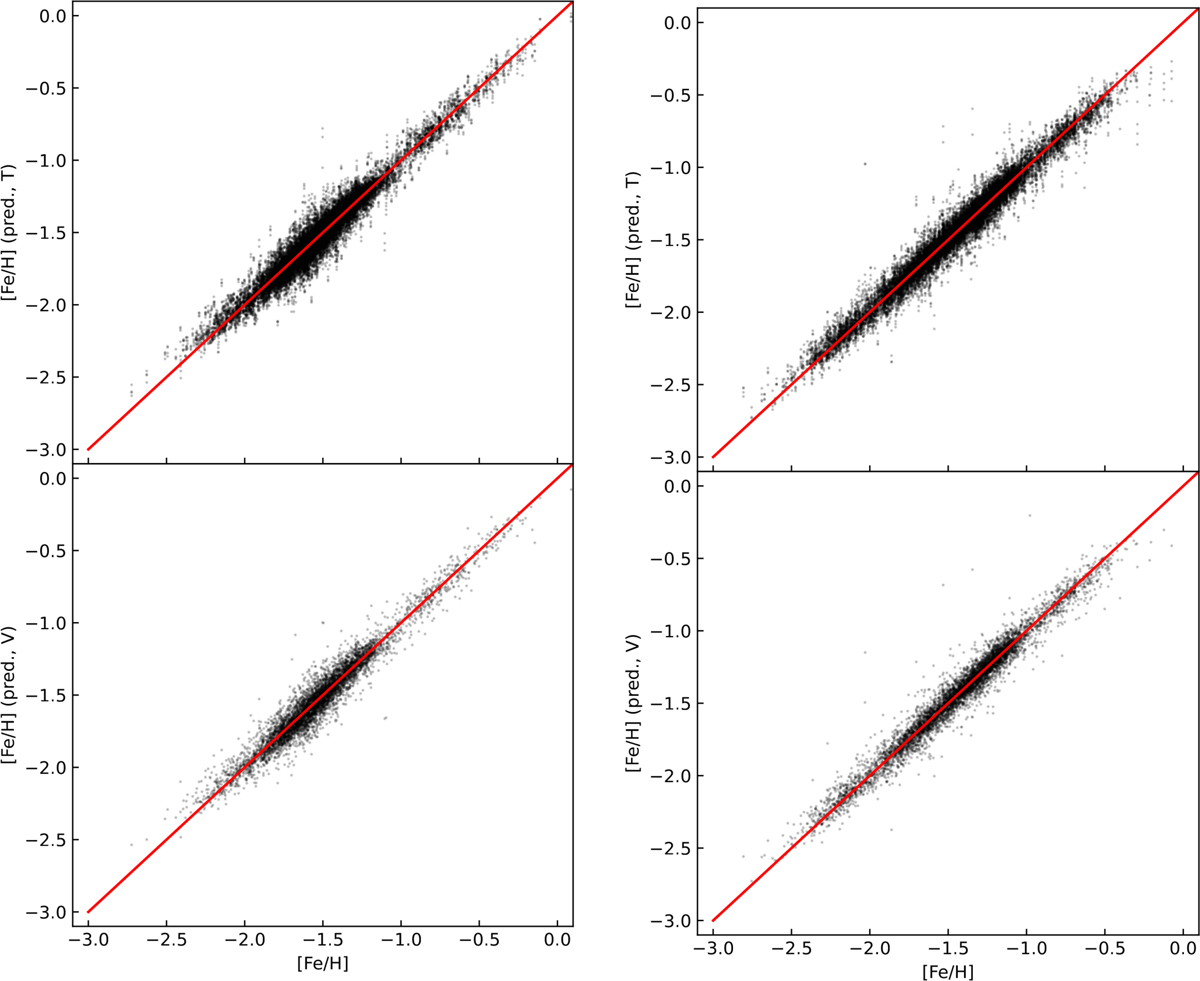
Fig. 6
Download original image
True versus predicted photometric metallicity values from the GRU predictive model for the RRab stars presented in Paper I (left panel) and RRc stars (right panel). In each case, the top and bottom panels correspond to the training (T) and validation (V) datasets, respectively. The red lines denote the identity function.
Current usage metrics show cumulative count of Article Views (full-text article views including HTML views, PDF and ePub downloads, according to the available data) and Abstracts Views on Vision4Press platform.
Data correspond to usage on the plateform after 2015. The current usage metrics is available 48-96 hours after online publication and is updated daily on week days.
Initial download of the metrics may take a while.