Fig. C.3
Download original image
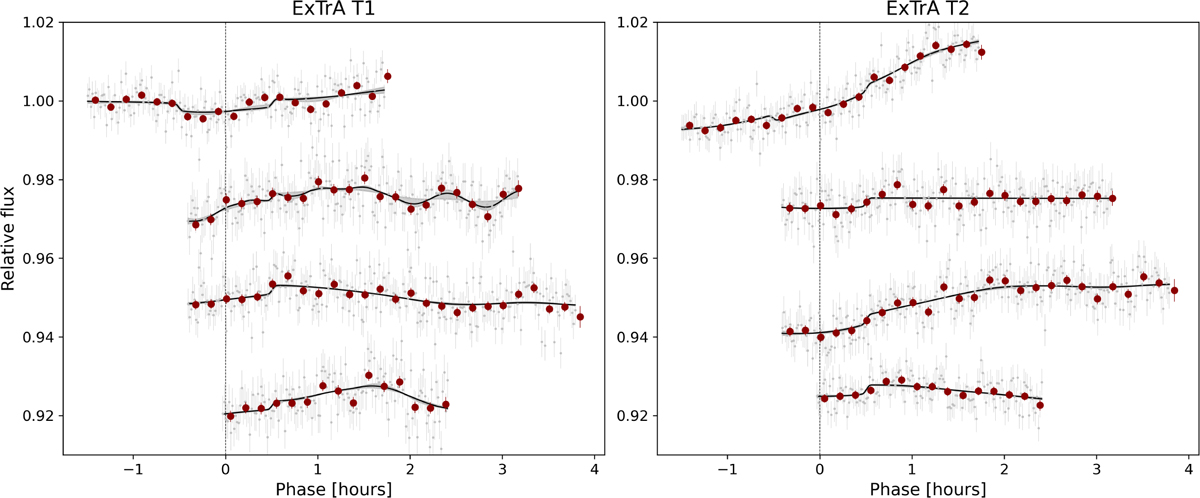
ExTrA light curves of the four different transits, observed with two telescopes (left panel: first telescope; right panel: second telescope). From top to bottom, the first transit is complete, while the remaining three show only the egress. The best-fit juliet models are shown as black lines, with 1σ model uncertainties indicated by the gray shaded regions. Dark red circles represent the data binned to 10 minutes. The dashed vertical line define the transit midpoint. An arbitrary offset has been added between the transits for clarity. See Sect. 5.2.3 for details on the modeling.
Current usage metrics show cumulative count of Article Views (full-text article views including HTML views, PDF and ePub downloads, according to the available data) and Abstracts Views on Vision4Press platform.
Data correspond to usage on the plateform after 2015. The current usage metrics is available 48-96 hours after online publication and is updated daily on week days.
Initial download of the metrics may take a while.