Fig. 2
Download original image
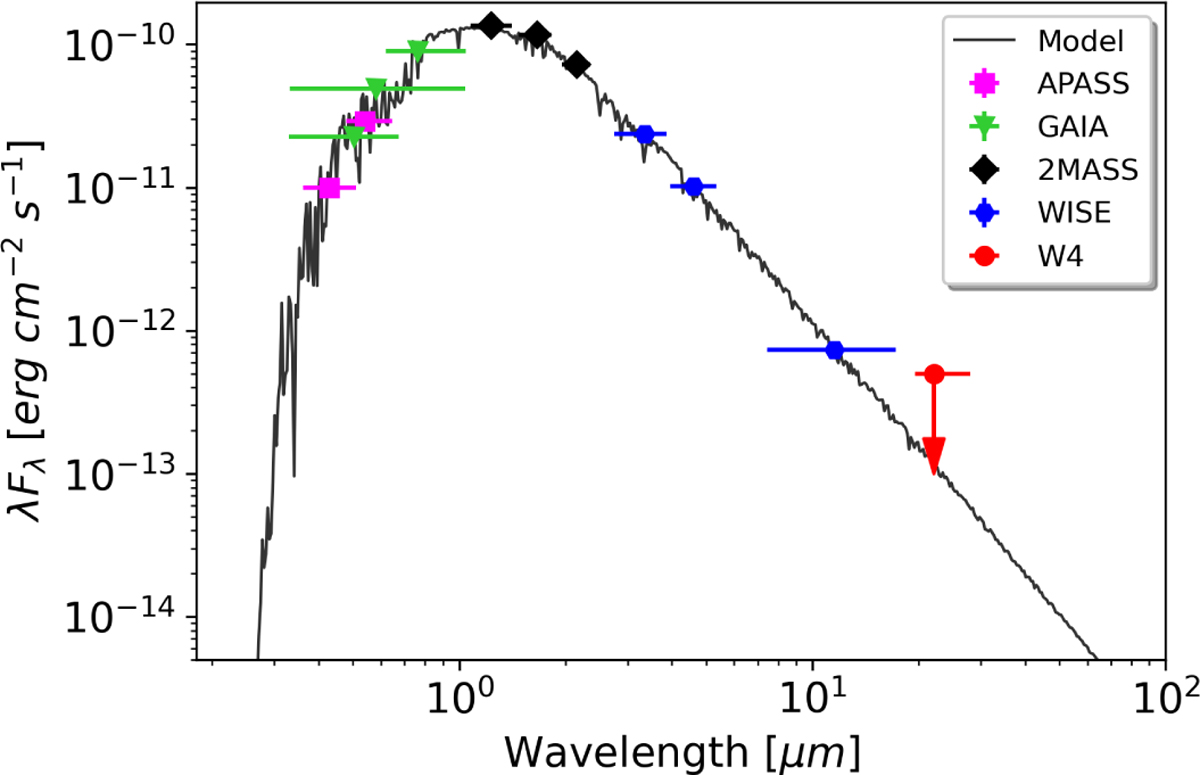
SED of TOI-756, constructed using broadband photometric data from APASS (magenta), Gaia (green), 2MASS (black), and WISE (blue). The upper limit for the WISE W4 band is indicated by a red dot. The horizontal error bars represent the passband widths of the respective filters. Below the SED, the residuals are shown, normalized to the photometric errors. The SED was modeled using the BT Settl atmospheric model (Allard et al. 2012) with Teff = 3600 K, [M/H] = 0 dex, and log g⋆ = 4.5 cm s−2.
Current usage metrics show cumulative count of Article Views (full-text article views including HTML views, PDF and ePub downloads, according to the available data) and Abstracts Views on Vision4Press platform.
Data correspond to usage on the plateform after 2015. The current usage metrics is available 48-96 hours after online publication and is updated daily on week days.
Initial download of the metrics may take a while.