Fig. 4
Download original image
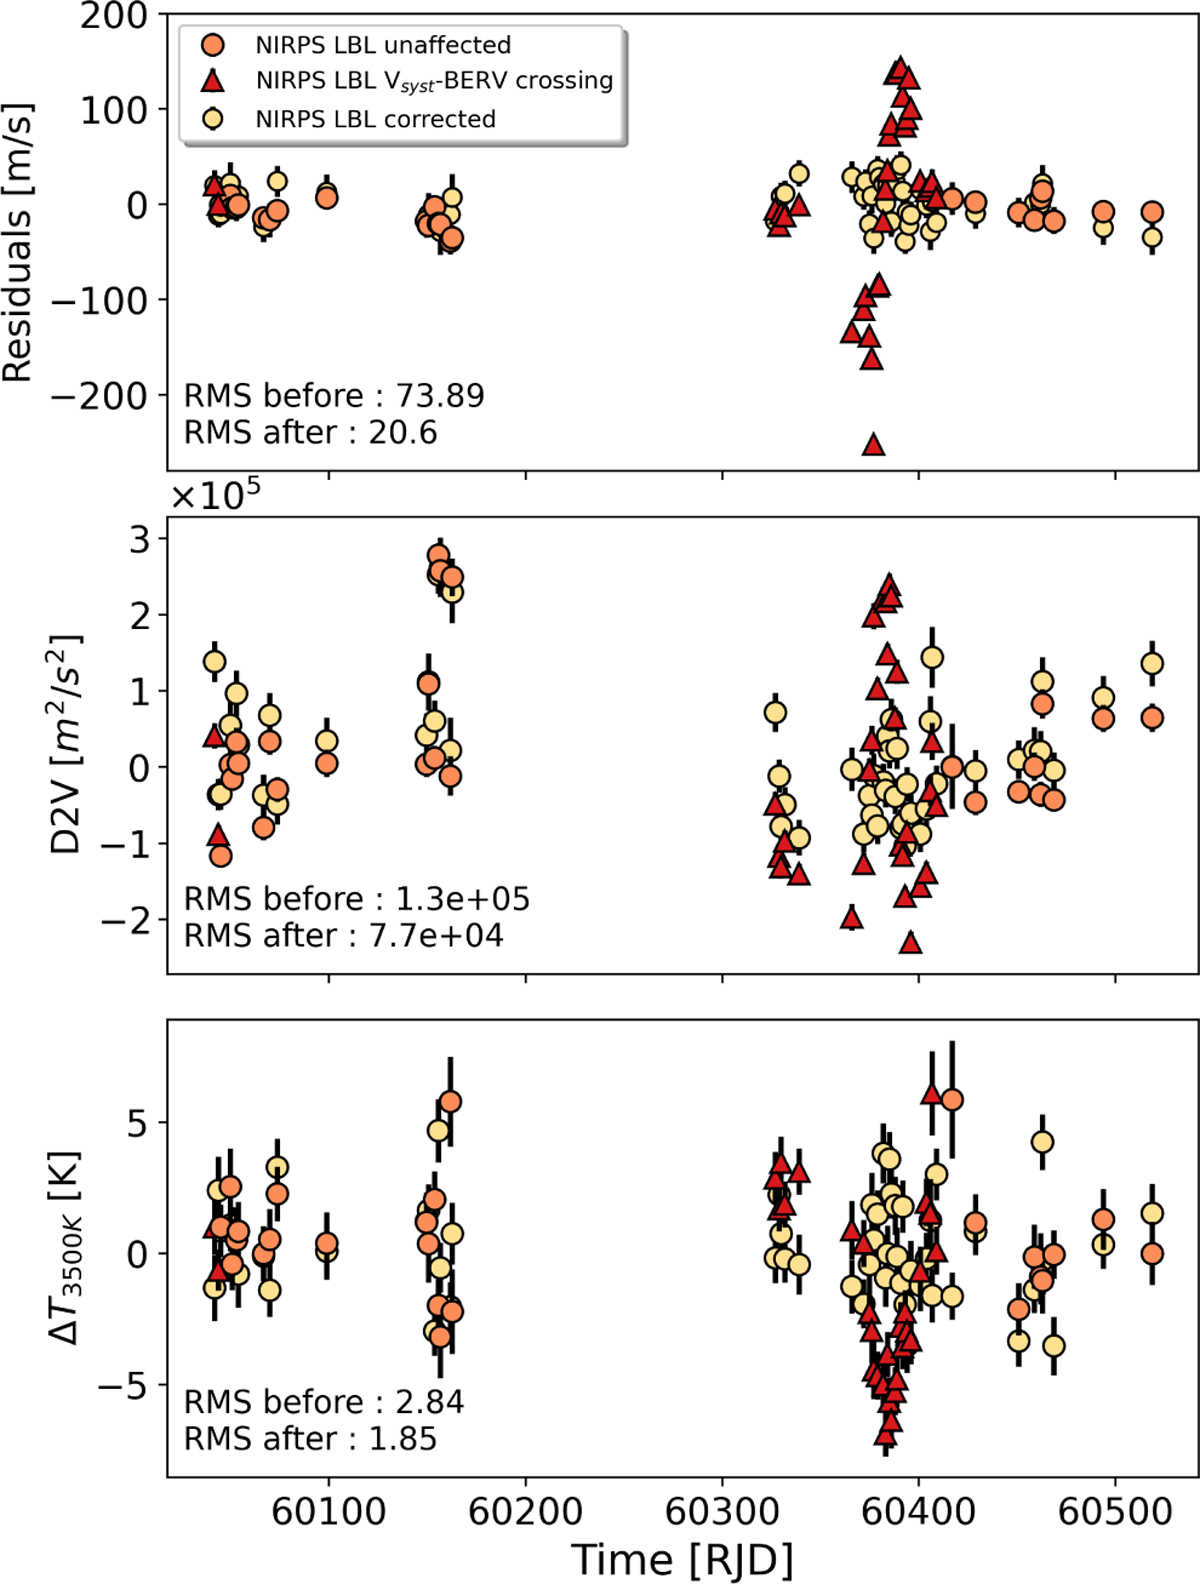
NIRPS data residuals (upper panel) and LBL indicators D2V (middle panel), along with dTemp (ΔT) calculated at 3500 K close to the effective temperature of TOI-756 (bottom panel). Orange dots are the indicators from unaffected NIRPS data, red triangles are the affected spectra by Vsyst−BERV crossing and yellow dots are the indicators with the correction explained in Sect. 5.2.2.
Current usage metrics show cumulative count of Article Views (full-text article views including HTML views, PDF and ePub downloads, according to the available data) and Abstracts Views on Vision4Press platform.
Data correspond to usage on the plateform after 2015. The current usage metrics is available 48-96 hours after online publication and is updated daily on week days.
Initial download of the metrics may take a while.