Fig. 5
Download original image
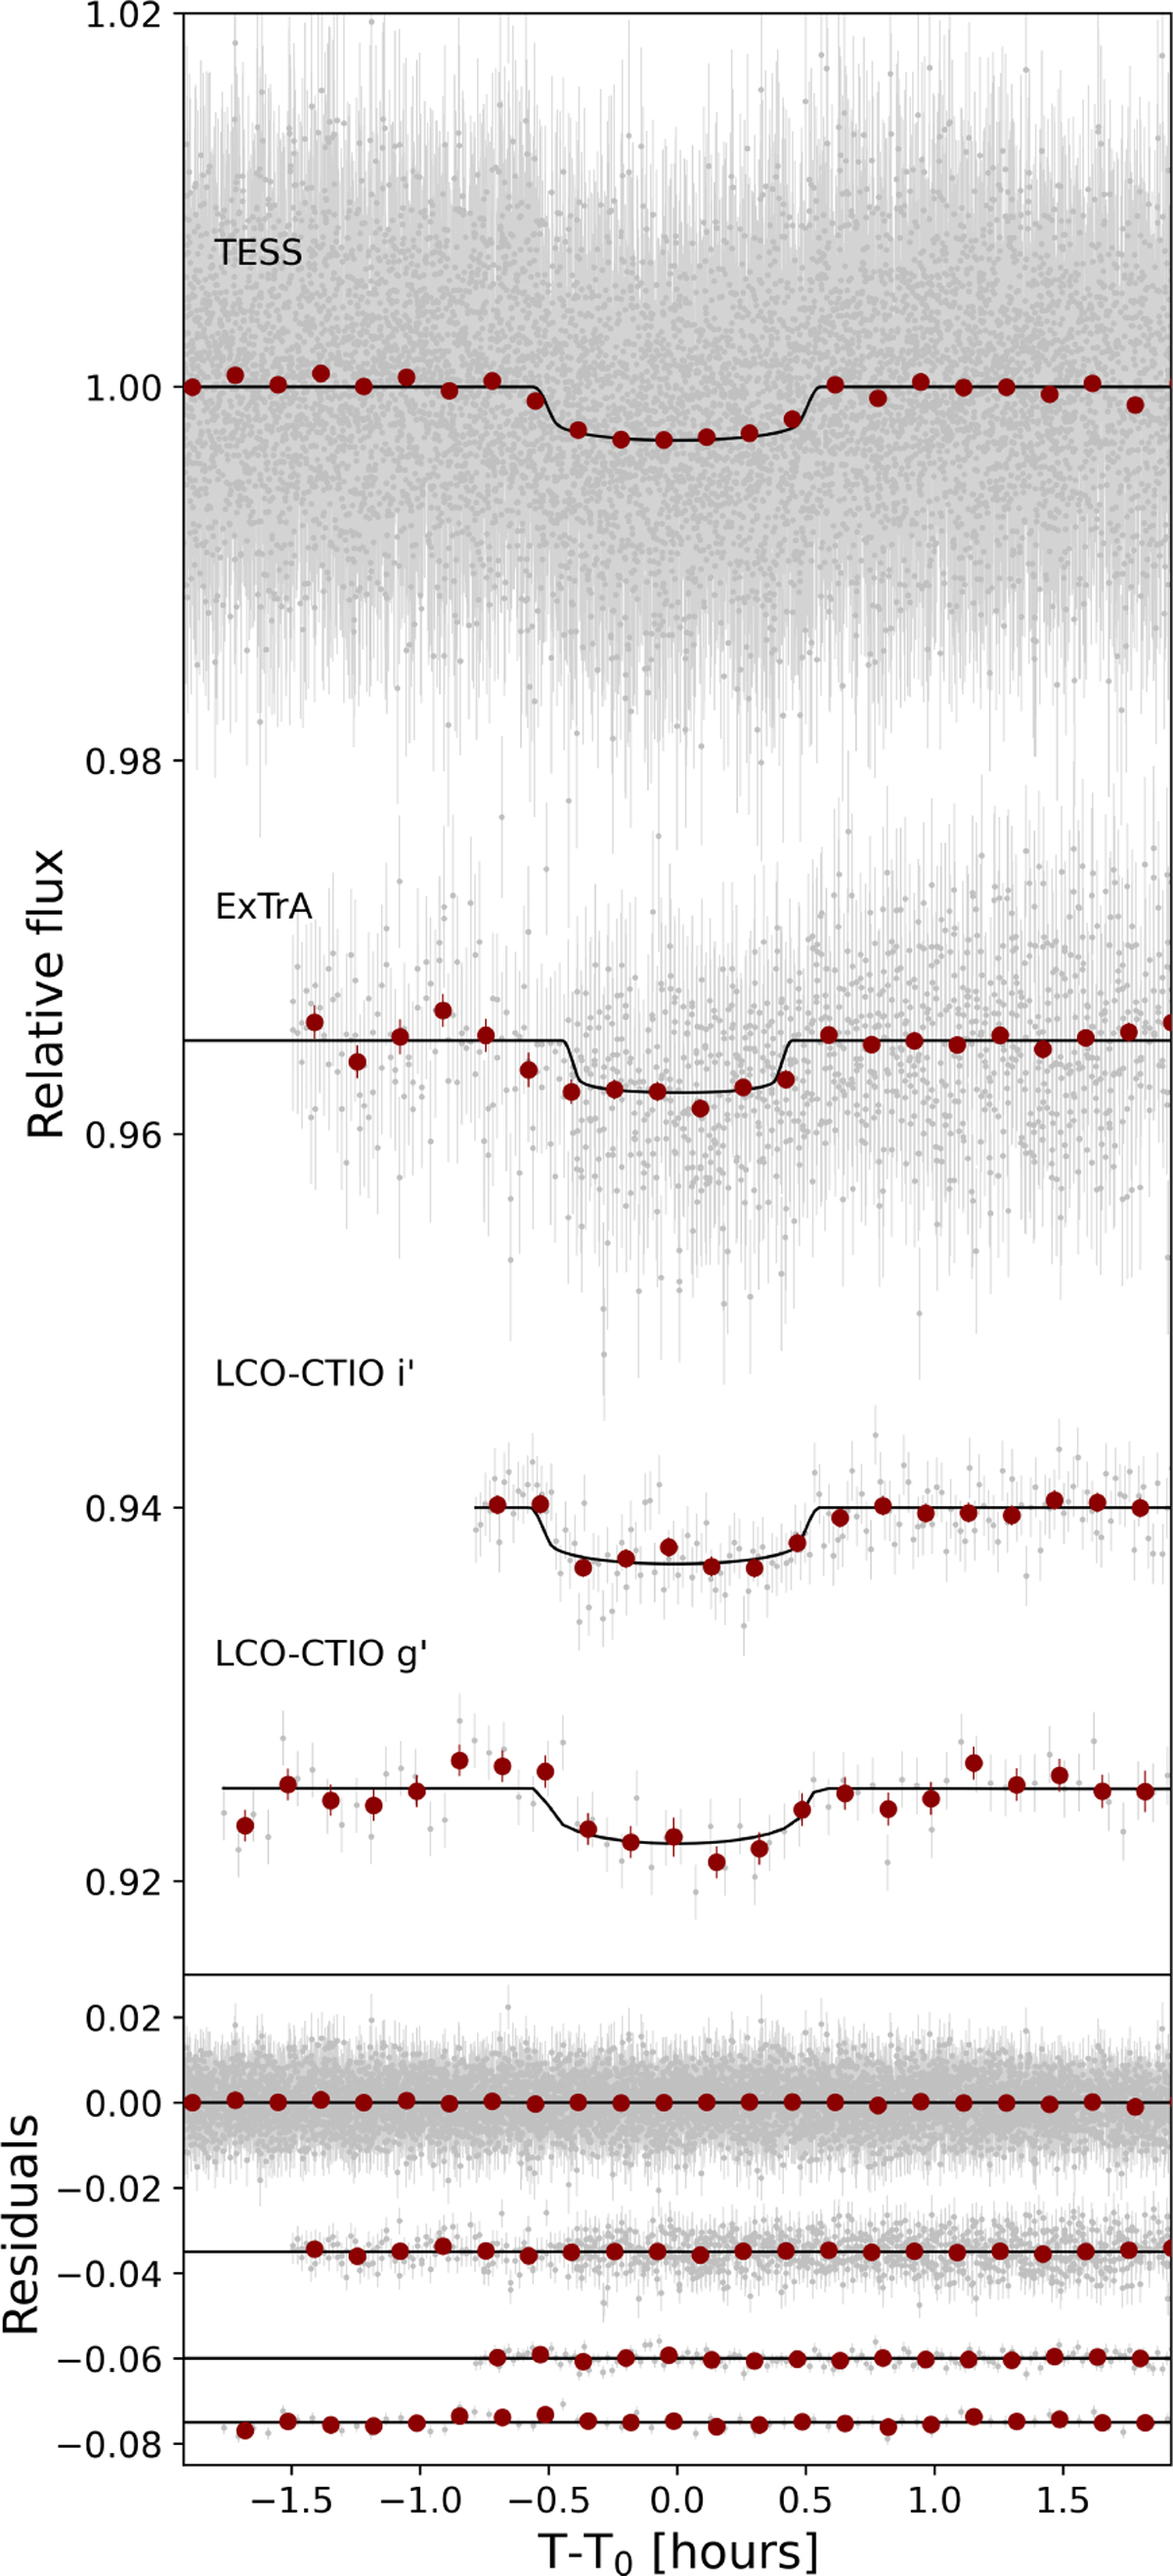
Top panel: phase-folded TESS, ExTrA, and LCO-CTIO light curves of TOI-756 b (gray points). Dark red circles are data binned to 10 min. The black lines represent the median model of each instrument from the joint fit. Bottom panel: residuals of the data compared to the model. An arbitrary offset has been added to the ground-based photometry for clarity.
Current usage metrics show cumulative count of Article Views (full-text article views including HTML views, PDF and ePub downloads, according to the available data) and Abstracts Views on Vision4Press platform.
Data correspond to usage on the plateform after 2015. The current usage metrics is available 48-96 hours after online publication and is updated daily on week days.
Initial download of the metrics may take a while.