Fig. 9
Download original image
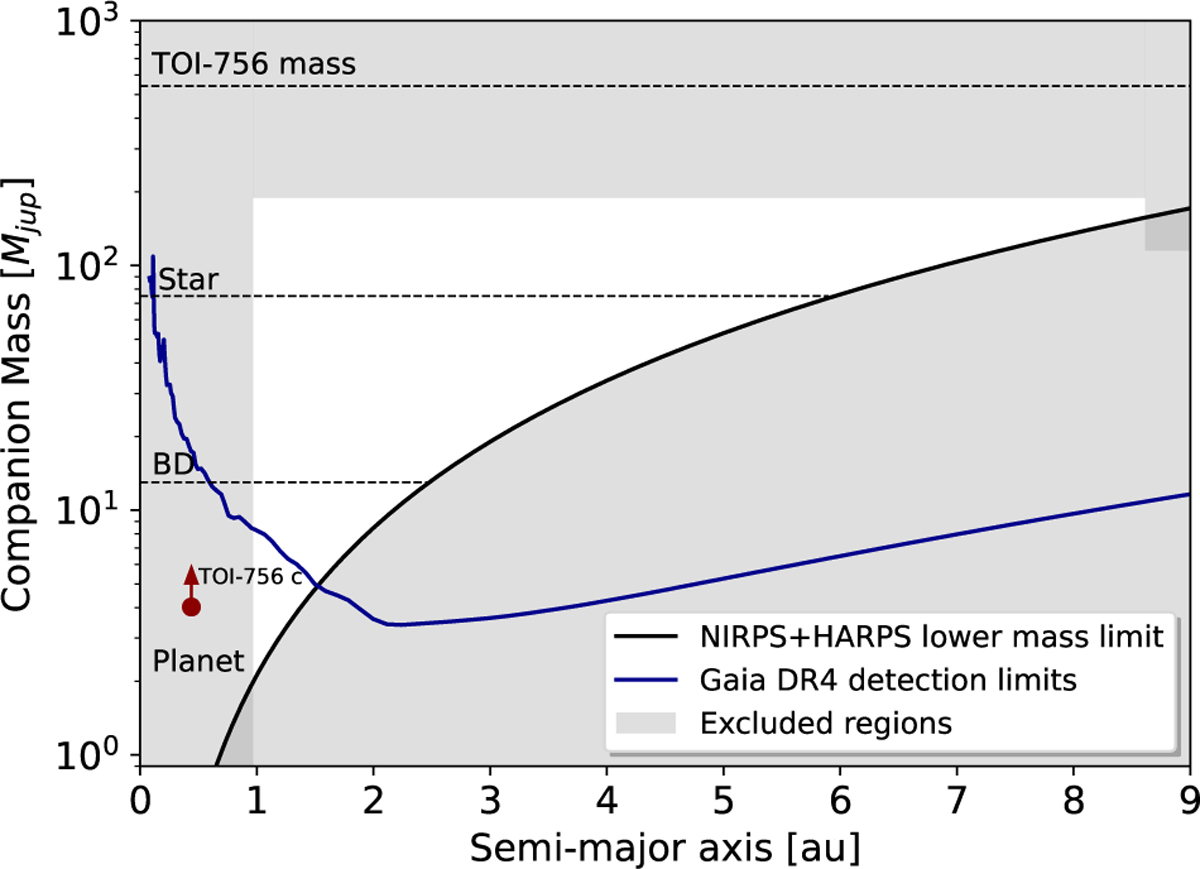
Limits on the companion mass of TOI-756 system as a function of semi-major axis. The lower limit, indicated by the solid black line, is calculated based on the RV linear trend. The excluded gray areas include this constraint of the RV linear trend, the timespan of observations of the RV (left rectangle), the limit from high-contrast imaging (upper right rectangle), and the absence of a double peak in the CCF (upper rectangle). We plotted the Gaia DR4 astrometric detection limits as a solid dark blue line for a star at 86 pc with a RUWE of 1.25 (Wallace et al. 2025). The dotted black lines are the different mass limit categories separating planetary, brown dwarf (BD), and stellar natures.
Current usage metrics show cumulative count of Article Views (full-text article views including HTML views, PDF and ePub downloads, according to the available data) and Abstracts Views on Vision4Press platform.
Data correspond to usage on the plateform after 2015. The current usage metrics is available 48-96 hours after online publication and is updated daily on week days.
Initial download of the metrics may take a while.