Fig. 4.
Download original image
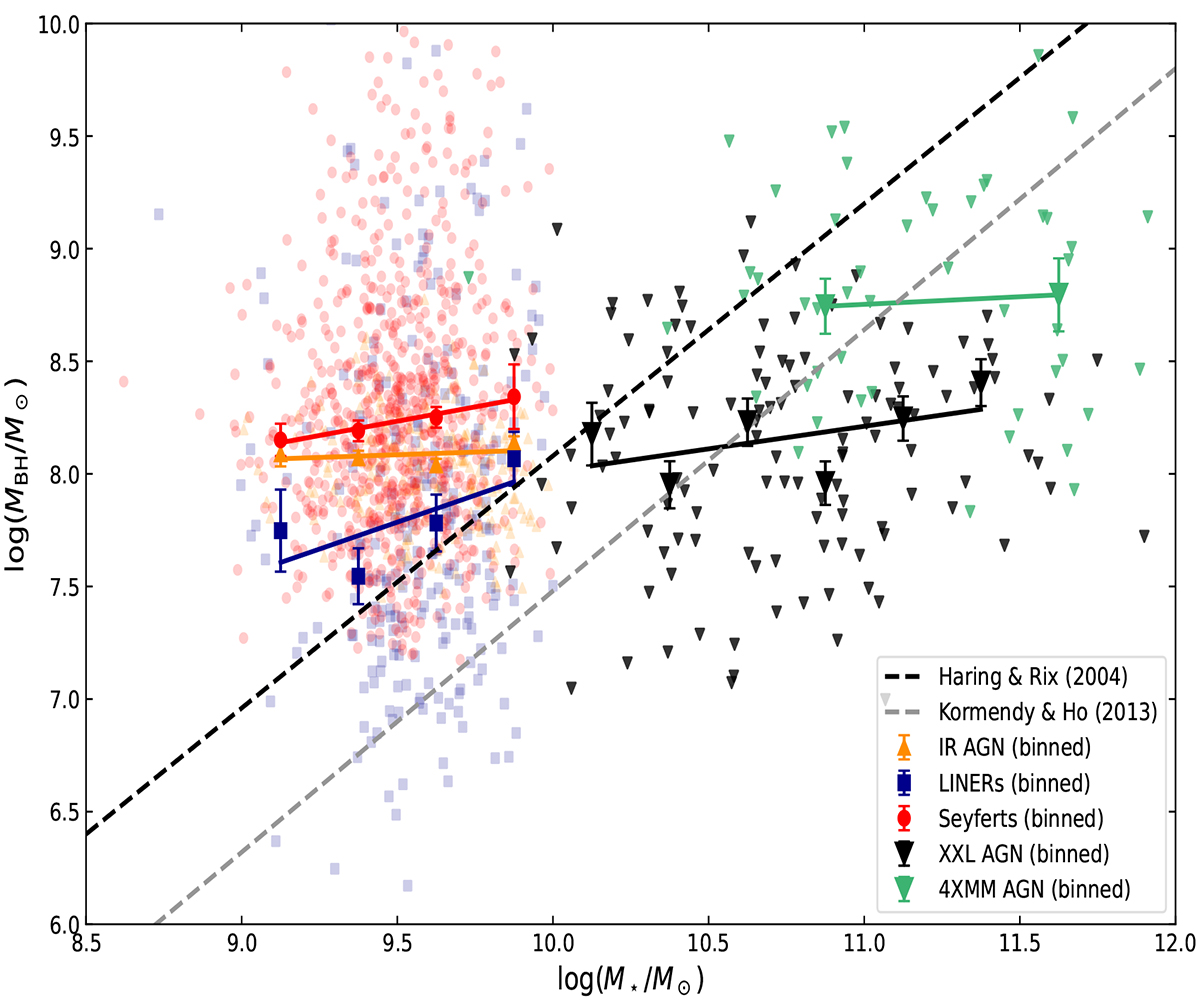
Black hole mass versus stellar mass for the three AGN populations. Small coloured symbols represent individual sources, with distinct shapes and colours indicating the different AGN populations, as shown in the legend. Large symbols indicate median values in stellar mass bins of width 0.25 dex. Error bars correspond to the standard error of the mean (1 σ) in each stellar mass bin, computed as the standard deviation divided by the square root of the number of sources in the bin. Solid lines show least-squares fits to the binned data. Dashed lines correspond to established MBH–M⋆ relations in the local Universe from the literature. Black and green markers denote X-ray-selected AGNs from the XMM-XXL and 4XMM surveys, respectively, restricted to the same redshift range as our sample (0.5 < z < 0.9). Corresponding solid lines show the best-fit relations for these X-ray AGN samples.
Current usage metrics show cumulative count of Article Views (full-text article views including HTML views, PDF and ePub downloads, according to the available data) and Abstracts Views on Vision4Press platform.
Data correspond to usage on the plateform after 2015. The current usage metrics is available 48-96 hours after online publication and is updated daily on week days.
Initial download of the metrics may take a while.