| Issue |
A&A
Volume 702, October 2025
|
|
|---|---|---|
| Article Number | A6 | |
| Number of page(s) | 11 | |
| Section | Extragalactic astronomy | |
| DOI | https://doi.org/10.1051/0004-6361/202555697 | |
| Published online | 26 September 2025 | |
Fuelling, evolution, and diversity of active galactic nuclei in dwarf galaxies: Insights from star formation and black hole scaling relations
1
Instituto de Fisica de Cantabria (CSIC-Universidad de Cantabria), Avenida de los Castros, 39005 Santander, Spain
2
Instituto de Astrofísica de Canarias, Vía Láctea, 38205 La Laguna, Tenerife, Spain
3
Instituto de Astrofísica de Canarias (IAC); Departamento de Astrofísica, Universidad de La Laguna (ULL), 38200 La Laguna, Tenerife, Spain
⋆ Corresponding author: This email address is being protected from spambots. You need JavaScript enabled to view it.
Received:
28
May
2025
Accepted:
20
August
2025
Abstract
We investigated the star formation activity and black hole scaling relations in a sample of 1 451 active galactic nuclei (AGNs) hosted by dwarf galaxies (log(M⋆/M⊙) < 10) at 0.5 < z < 0.9, drawn from the VIPERS survey. The sample comprises Seyferts and low-ionization nuclear emission-line regions (LINERs) identified through emission-line diagnostics, as well as IR-selected AGNs based on WISE mid-IR colours. Using the normalized star formation rate (SFRnorm), defined as the ratio of the SFR of a galaxy hosting an AGN to the median SFR of star-forming galaxies of similar stellar masses and redshifts, we compared AGN hosts to a control sample of non-AGN star-forming galaxies. We examined how SFRnorm varies with AGN power (L[OIII]), black hole mass (MBH), local environment, and stellar population age. We also analysed the MBH–M⋆ relation and the evolution of the MBH/M⋆ ratio, incorporating comparisons to X-ray AGNs and high-redshift quasars (z > 4). We note that black hole masses have been estimated from narrow-line diagnostics, which introduce significant scatter and can carry substantial uncertainties for individual sources, though they remain useful for identifying statistical trends. Our key findings are: (i) All AGN populations show suppressed star formation at low AGN luminosities, with SFRnorm rising above unity at different luminosity thresholds depending on AGN type. (ii) LINERs show flat SFRnorm trends with MBH, remaining broadly consistent with unity. Seyferts display a mild increase with MBH, while IR AGNs show a more pronounced positive trend. (iii) LINERs have older stellar populations than Seyferts. (iv) At fixed stellar mass, Seyferts host more massive black holes than LINERs, with IR AGNs falling in between. (v) The MBH/M⋆ ratio is elevated relative to local scaling relations and remains approximately constant with redshift over 0.5 < z < 0.9, in agreement with high-z AGN measurements. (vi) The ratio decreases with stellar mass up to log(M⋆/M⊙)∼11, beyond which it flattens towards values consistent with those of local, inactive galaxies; this trend is clearest for Seyferts and IR AGNs, while LINERs show no clear dependence. These results suggest that AGNs in dwarf galaxies follow diverse evolutionary pathways, shaped by gas availability, feedback, and selection effects.
Key words: galaxies: active / galaxies: dwarf / galaxies: evolution / galaxies: formation / galaxies: Seyfert / galaxies: star formation
© The Authors 2025
 Open Access article, published by EDP Sciences, under the terms of the Creative Commons Attribution License (https://creativecommons.org/licenses/by/4.0), which permits unrestricted use, distribution, and reproduction in any medium, provided the original work is properly cited.
This article is published in open access under the Subscribe to Open model. This email address is being protected from spambots. You need JavaScript enabled to view it. to support open access publication.
1. Introduction
Supermassive black holes (SMBHs) are widely accepted as key components influencing the evolution of their host galaxies through energetic feedback processes associated with active galactic nuclei (AGNs). AGN activity, fuelled by accretion onto SMBHs, can inject substantial amounts of energy into their surroundings, affecting star formation, gas distribution, and the overall growth and quenching of galaxies (e.g. Silk & Rees 1998; Kormendy & Ho 2013). Understanding the role and impact of SMBHs in galaxy evolution is thus fundamental for building comprehensive galaxy formation models.
While AGN activity in massive galaxies has been extensively studied, dwarf galaxies, typically defined as having stellar masses log(M⋆/M⊙)≲10 (e.g. Reines et al. 2013; Mezcua et al. 2016; Greene et al. 2020), have recently attracted significant attention as valuable laboratories for studying the early phases of galaxy evolution and SMBH formation (e.g. Penny et al. 2018; Manzano-King et al. 2019; Birchall et al. 2020). Dwarf galaxies are important because they represent the most abundant galaxy population in the Universe (e.g. Baldry et al. 2012) and are believed to host intermediate-mass black holes (103 − 105 M⊙), which may provide crucial insights into the seed black holes that evolved into SMBHs in more massive galaxies (e.g. Volonteri 2010; Mezcua 2017; Greene et al. 2020).
In recent years, a growing number of observational studies have successfully identified AGNs in dwarf galaxies (e.g. Reines et al. 2013; Pardo et al. 2016; Baldassare et al. 2016, 2020; Mezcua et al. 2016, 2018; Mezcua & Domínguez Sánchez 2020; Kaviraj et al. 2019; Greene et al. 2020; Manzano-King & Canalizo 2020; Polimera et al. 2022; Siudek et al. 2023; Pucha et al. 2025). These studies have revealed several key trends: AGNs in dwarf galaxies are preferentially found in environments that support gas-rich interactions or mergers (e.g. Kaviraj et al. 2019; Mezcua & Domínguez Sánchez 2020; Eróstegui et al. 2025), have high central star formation rates (SFRs) compared to inactive dwarfs (e.g. Reines et al. 2013; Polimera et al. 2022), and can significantly affect the chemical and morphological evolution of their hosts (Mezcua et al. 2018). Theoretically, recent simulations suggest that AGN feedback in dwarf galaxies can play a pivotal role in regulating their evolution–affecting gas retention, quenching star formation, and reshaping their growth pathways (e.g. Koudmani et al. 2024; Arjona-Gálvez et al. 2024). These models highlight the sensitivity of dwarf systems to even low-level SMBH activity, and predict that such feedback can leave long-lasting imprints on their star formation and structural properties.
A fundamental approach to investigating SMBH–galaxy co-evolution is to compare the SFRs of galaxies that host AGNs to those without active nuclei. Such comparative analyses have been extensively conducted for massive galaxies, revealing complex trends of star formation acceleration or suppression correlated with AGN luminosity and host galaxy properties (e.g. Rosario et al. 2012; Santini et al. 2012; Mullaney et al. 2015; Masoura et al. 2018, 2021; Bernhard et al. 2019; Florez et al. 2020; Mountrichas et al. 2021a, 2022a,b; Pouliasis et al. 2022; Koutoulidis et al. 2022; Torbaniuk et al. 2024; Mountrichas et al. 2024a,b,c; Cristello et al. 2024; Zhang et al. 2025; Kondapally et al. 2025). In the context of dwarf galaxies, recent studies have found that AGN feedback does not significantly impact the star formation of their hosts (Siudek et al. 2023). A detailed multi-wavelength analysis of the dwarf galaxy NGC 4395 suggests that some AGN-hosting dwarfs have higher central SFRs, indicating that low-luminosity AGN activity can co-exist with, or even promote, star formation on sub-galactic scales (Nandi et al. 2023).
Another critical avenue for exploring the connection between SMBHs and their host galaxies is through the correlation between black hole mass (MBH) and stellar mass (M⋆), which has been extensively studied in massive galaxies up to redshift z ∼ 2 (e.g. Magorrian et al. 1998; Ferrarese & Merritt 2000; Jahnke 2009; Kormendy & Ho 2013; Reines & Volonteri 2015; Sun et al. 2015; Suh et al. 2020; Setoguchi et al. 2021; Mountrichas 2023). For dwarf galaxies, however, this correlation is less well established due to the intrinsic observational challenges and the scarcity of robust SMBH measurements. Recent studies that have addressed this issue indicate that dwarf galaxies tend to host relatively massive black holes for their stellar mass, implying that SMBH growth can precede or outpace stellar growth in low-mass systems (e.g. Mezcua et al. 2023, 2024; Greene et al. 2024; Sun et al. 2025a). Notably, similar elevated black hole-to-stellar mass ratios have been observed at high redshifts (z > 4), hinting at potentially analogous growth mechanisms or evolutionary pathways operating in both early-Universe galaxies and local dwarf populations (e.g. Sun et al. 2025b; Ding et al. 2023; Yue et al. 2024).
In this paper we present a detailed analysis of the interplay between star formation activity, black hole mass, and host galaxy properties in a large, systematically selected sample of dwarf galaxies that host AGNs drawn from the VIMOS Public Extragalactic Redshift Survey (VIPERS) within the redshift range 0.5 < z < 0.9. Utilizing optical and IR diagnostics, we identify Seyferts, low-ionization nuclear emission-line regions (LINERs), and IR-selected AGNs, alongside a carefully constructed control sample of star-forming galaxies matched in stellar mass, colour, and redshift. We investigate how AGN activity correlates with star formation and local environment, and we extend our analysis to include comparisons with X-ray-selected AGN populations and high-redshift sources to provide a comprehensive view of SMBH–galaxy co-evolution across a wide range of galaxy masses and cosmic epochs.
2. Data
In this section we briefly describe the parent dataset, the derived physical parameters, and the methods used to compute them. A comprehensive overview of the data and analysis procedures can be found in Siudek et al. (2023, see their Sect. 2). For completeness, we provide a concise summary below.
2.1. The parent sample
The galaxy sample analysed in this study is drawn from VIPERS (Scodeggio et al. 2018), a large spectroscopic campaign conducted with the VIMOS instrument on the ESO Very Large Telescope (Le Fèvre et al. 2003). VIPERS provides high-quality spectra for over 86 000 galaxies in the redshift range 0.5 < z < 1.2, selected to a magnitude limit of iAB ≤ 22.5. The survey covers approximately 23.5 deg2 across the CFHTLS-W1 (15.7 deg2) and CFHTLS-W4 (7.8 deg2) fields.
The signal-to-noise ratio (S/N) of the spectra depends primarily on galaxy brightness and observing conditions, and is quantified through a redshift quality flag (z_flag). High-confidence redshift measurements correspond to spectra with strong features and S/N sufficient for secure redshift determination (typically > 90% confidence). Only galaxies with z_flag values between 2 and 9, indicating reliable redshift estimates, are included in the analysis (Guzzo et al. 2014; Garilli et al. 2014; Scodeggio et al. 2018).
To construct their sample of dwarf galaxies, Siudek et al. (2023) selected 33 333 VIPERS galaxies with stellar masses below log(M⋆/M⊙) = 10.0 and reliable redshift measurements (≥90% confidence). This stellar mass threshold is slightly more inclusive than the commonly adopted value for dwarf galaxies (typically log(M⋆/M⊙)≲9.5), but it is consistent with other studies focused on AGNs in low-mass systems and results in a statistically significant sample across environments. Importantly, a high fraction of galaxies in the 9 < log(M⋆/M⊙) < 10 range are expected to host intermediate-mass black holes. After applying various quality criteria their final sample consisted of 12 942 dwarf galaxies in the redshift range 0.5 < z ≤ 0.9.
2.2. The AGN datasets
To identify AGNs within the final sample of 12 942 dwarf galaxies, Siudek et al. (2023) employed two complementary selection methods. The first is based on an emission-line diagnostic diagram using [OII]λ3726, Hβ, and [OIII]λ5007, following the methodology of Lamareille (2010). This approach extends traditional BPT diagnostics (Baldwin et al. 1981) to higher redshifts (z > 0.45), where Hα and NII are no longer within the observed spectral range. Emission line equivalent widths rather than fluxes were used to mitigate the effects of dust attenuation. Afterapplying a series of quality criteria to ensure reliable line detections–including constraints on line width, peak position, and amplitude, a final sample of 4315 dwarf galaxies with high-confidence line measurements was selected. From these, 1050 were classified as AGNs (787 Seyferts and 263 LINERs) based on their position in the diagnostic diagram.
A second, independent AGN sample was identified using mid-IR photometry from WISE, matched to the optical dataset within a 10-arcsecond radius. AGN candidates were selected based on mid-IR colour cuts proposed by Hviding et al. (2022), optimized for high completeness. This yielded 393 additional IR AGNs not overlapping with the optical sample. We note that M⋆ are derived from full spectral energy distribution fitting across UV to near-IR wavelengths, which naturally accounts for dust extinction via reddening and template fitting (see Sect. 2.4 and Moutard et al. 2016). Additionally, SFRs are corrected for extinction using the Balmer decrement where available, or derived from [OII] luminosities following established prescriptions that include dust corrections (e.g. Kewley et al. 2004). Thus, dust attenuation has been consistently treated in the estimation of host galaxy properties for all AGN types, including the IR-selected sample. Figure 1 presents the M⋆ and redshift distributions of the three AGN datasets. The three AGN populations exhibit similar distributions in both M⋆ and redshift. Kolmogorov–Smirnov (KS) test yield a p-value higher than 0.6 in all cases.
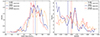 |
Fig. 1. Distributions of stellar mass (left) and redshift (right) for the three AGN populations. The mean (μ) and median (med) values for each distribution are indicated in the legends. Vertical lines correspond to mean values. |
2.3. Control sample
To enable a fair comparison with AGN hosts, a control sample of 1050 star-forming galaxies was constructed by matching each AGN to a non-AGN galaxy with similar stellar mass, redshift, and optical colour (r − i). The matching procedure follows the methodology of Cheung et al. (2015) and Kristensen et al. (2020), using a nearest-neighbour approach in three-dimensional parameter space. As a result, the control sample closely mirrors the AGN population in terms of key physical properties. The average differences in stellar mass and colour between the AGN and control samples are less than 0.2 times the standard deviation of the corresponding distribution for the AGN sample. Statistical tests confirm that the two samples are indistinguishable in stellar mass and colour across all redshift bins (Siudek et al. 2023).
2.4. Physical properties
A large number of physical properties have been calculated in Siudek et al. (2023, see also Moutard et al. 2016) and are available. M⋆ has been derived through spectral energy distribution fitting using the LePhare code (Ilbert 2006) and a library of templates based on Bruzual & Charlot (2003) models with a Chabrier (2003) initial mass function. Photometric inputs span UV to near-IR wavelengths. The SFR is derived from extinction-corrected [OII] luminosity following Kewley et al. (2004), which provides better consistency across the redshift range given limited far-IR coverage.
Galaxy structural parameters – the effective radius (Re) and the Sérsic index (n) – were obtained from GALFIT modelling Peng et al. (2002) of CFHTLS i-band images (Krywult et al. 2017). Environmental densities are characterized using the local overdensity parameter δ from Cucciati et al. (2017), computed within cylinders defined by the 5th-nearest neighbour approach and calibrated to avoid redshift evolution biases.
Black hole masses for the optical AGNs in our sample have also been measured in Siudek et al. (2023). For their calculation the empirical calibration from Baron & Ménard (2019) was combined with Eq. (1) of Ferré-Mateu et al. (2021). The method is designed for use with narrow-line AGNs and does not require the presence of broad emission lines. It is based on an empirical correlation between the narrow-line luminosity ratio L([O III])/L(Hβ) and the full width at half maximum of the broad Hα emission line.
Specifically, black hole masses were estimated using the following equation:
![Mathematical equation: $$ \begin{aligned} \log \left( \frac{M_{\rm BH}}{M_\odot } \right) = 3.55 \log \left( \frac{L_{\rm [OIII]}}{L_{\rm H\beta }} \right) + 0.59 \log L_{\rm bol} - 20.96, \end{aligned} $$](/articles/aa/full_html/2025/10/aa55697-25/aa55697-25-eq1.gif) (1)
(1)
as proposed by Baron & Ménard (2019), where L[OIII] and LHβ are the extinction-corrected luminosities of the [O III]λ5007 and Hβ lines. The bolometric luminosity (Lbol) was estimated following the prescription in Netzer (2009):
![Mathematical equation: $$ \begin{aligned} \log L_{\rm bol} = \log L_{\rm H\beta } + 3.48 + \max \left[ 0,\, 0.31 \left( \log \left( \frac{L_{\rm [OIII]}}{L_{\rm H\beta }} \right) - 0.6 \right) \right]. \end{aligned} $$](/articles/aa/full_html/2025/10/aa55697-25/aa55697-25-eq2.gif) (2)
(2)
This formalism has been shown to correlate with black hole masses derived via stellar velocity dispersions or broad-line virial methods, particularly for Type 2 AGNs. The specific combination of emission line ratios and bolometric corrections in Eq. (1) of Ferré-Mateu et al. (2021) provides a practical calibration that can be applied to large AGN samples lacking broad line region measurements.
While the method introduces a non-negligible scatter (up to ∼1 dex; Reis 2020), it does not appear to introduce a systematic offset in MBH. The technique has been employed successfully in previous studies (e.g. Vietri et al. 2022), including those involving low-mass AGNs and dwarf galaxies (e.g. Siudek et al. 2023). Given the large number of sources in our sample and our use of binned statistics throughout the analysis (see Sects. 3 and 4), the effects of this intrinsic scatter should be diluted when interpreting global trends. We nevertheless caution that individual MBH estimates can carry large uncertainties.
2.5. Calculation of SFRnorm
To investigate the star formation properties of different AGN types relative to star-forming dwarf galaxies, we used the SFRnorm parameter (e.g. Mullaney et al. 2015; Masoura et al. 2018; Mountrichas et al. 2021b, 2022a,b; Koutoulidis et al. 2022; Pouliasis et al. 2022). This parameter is defined as the ratio of the SFR of an AGN host to that of non-AGN star-forming galaxies with similar properties. Specifically, for each AGN, we identified all galaxies from the control sample described in Sect. 2.3 that lie within ±0.1 dex in stellar mass and ±0.1 in redshift. We then computed the SFR ratio between the AGN and each of these matched galaxies. The median of these individual ratios was adopted as the SFRnorm of the AGN. Uncertainties were estimated via bootstrap resampling and correspond to the 1σ scatter. As shown in Mountrichas et al. (2021b), this approach is robust to the exact choice of matching window, although narrower ranges may yield fewer matches. We restricted our analysis to AGNs with at least 50 matched galaxies in the control sample. Additionally, only bins containing a minimum of 10 AGNs were used in the analysis to ensure statistical robustness.
To compute the SFRnorm parameter, it is essential to identify and exclude quiescent systems from both the AGN and non-AGN galaxy samples. The galaxy control sample already includes only star-forming galaxies (Sect. 2.3). To identify quiescent systems within the AGN datasets, we examined their specific star formation rates (sSFRs). Figure 2 presents the log(sSFR) [Gyr−1] distributions for the AGN populations used in this work. All three AGN samples exhibit a prominent peak at similar values (around 0.03), indicating no evidence of a secondary, lower peak that would typically signify a quiescent sub-population (e.g. Mountrichas et al. 2021b, 2022a,b).
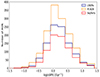 |
Fig. 2. Distributions of sSFRs ( |

Alternative criteria to define quiescent systems have also been explored in the literature. For example, Salim et al. (2018) adopt a threshold of 1 dex below the mean sSFR, yet only a very small number of AGNs in our samples fall below this limit (see Fig. 2). Similarly, studies such as Franx et al. (2008) have employed a fixed cut at log(sSFR) [Gyr−1]= − 2, but none of the AGNs in our datasets satisfy this condition.
A more conservative definition, where quiescent systems are those with log(sSFR) values at least 0.3 dex below the mean (e.g. Muzzin et al. 2013; Shimizu et al. 2015; Koutoulidis et al. 2022), identifies roughly 9–12% of AGNs as quiescent in our sample. Despite this, we chose to retain these sources in our analysis. We verified that excluding them does not impact our main conclusions: while the SFRnorm values do increase slightly (by approximately 0.1 dex), this shift lies well within the statistical uncertainties of our measurements.
3. Results
In this section we present a comparative analysis of the SFRs of different AGN populations and star-forming galaxies, exploring their dependence on AGN power, black hole mass, and cosmic environment. We also examine differences in their stellar populations and investigate the MBH–M⋆ relation across the various AGN types.
3.1. AGNs and star-forming dwarfs: Star formation across luminosity, black hole mass, and environment
The top-left panel of Fig. 3 presents SFRnorm as a function of log L[OIII] for the various AGN populations. All AGN types show similar trends, regardless of selection method: at low luminosities, AGNs in dwarf galaxies exhibit suppressed star formation compared to star-forming galaxies of similar mass (SFRnorm < 1). As luminosity increases, SFRnorm rises, and above a threshold of log L[OIII], AGNs begin to show enhanced star formation relative to the control sample.
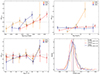 |
Fig. 3. Normalized SFR (SFRnorm) for the three AGN populations as a function of key physical parameters. Top left: SFRnorm versus [OIII] luminosity. Top right: SFRnorm as a function of black hole mass. Bottom left: SFRnorm as a function of environmental density. Bottom right: Distributions of stellar ages, using the D4000 index as a proxy. |
These trends mirror those observed for X-ray-selected AGNs in more massive galaxies (10 < log(M⊙) < 12), where AGNs generally display lower or comparable SFRs to star-forming galaxies at low and intermediate X-ray luminosities (LX), with enhanced SFR only emerging above a luminosity threshold (Masoura et al. 2018; Pouliasis et al. 2022). Notably, the LX threshold for this transition increases with the stellar mass of the host galaxy (Mountrichas et al. 2021b, 2022b,a, 2024a; Cristello et al. 2024).
While all three AGN types exhibit a general increase in SFRnorm with luminosity, the luminosity threshold at which this transition occurs differs across populations. LINERs show enhanced star formation above log L[OIII] ∼ 41, Seyferts at ∼41.75, and IR AGNs fall in between, though with larger associated uncertainties. The observed variation in the luminosity threshold at which SFRnorm exceeds unity among AGN types may reflect intrinsic differences in their fuelling mechanisms or evolutionary stage. It is important to note, though, that for IR AGNs, which are often heavily obscured, the observed [OIII] luminosity likely underestimates the intrinsic AGN power due to dust extinction. As a result, their SFRnorm values at a given L[OIII] should be interpreted with caution, as these AGNs may be intrinsically more powerful than suggested by their optical line luminosity.
The top-right panel of Fig. 3 shows SFRnorm as a function of black hole mass. LINERs exhibit an almost flat trend, with SFRnorm values systematically below unity, though largely consistent with it within uncertainties. Seyferts, in contrast, display a mild upward trend, suggesting a moderate increase in SFRnorm with black hole mass. The SFRnorm of IR-selected AGNs rise more as MBH increases, and these AGNs have a narrower range of black hole masses than LINERS and Seyferts. A similar trend, i.e. a rise in the SFR with black hole mass, has also been observed in X-ray-selected AGNs (Mountrichas & Buat 2023). It is also worth noting that in both IR-selected and X-ray-detected AGNs, SFRnorm exceeds unity at comparable black hole masses.
The bottom-left panel of Fig. 3 shows the SFRnorm as a function of environment density, log (1 + δ), for the different AGN populations. Seyferts maintain relatively flat SFRnorm values below unity across all environments. LINERs and IR AGNs, on the other hand, show a possible upturn in SFRnorm at the densest environments, though this is driven by a single bin and should be interpreted with caution.
Finally, the bottom-right panel of Fig. 3 shows the distribution of the D4000 index for the three AGN populations. While the mean and median values across IR AGNs, Seyferts, and LINERs differ only modestly, KS tests indicate that these differences are statistically significant (p-value < 0.01 in all cases). These results suggest that Seyfert hosts tend to exhibit younger stellar populations compared to LINERs and IR AGNs. We note that D4000 measurements in VIPERS have typical uncertainties of ≲0.1 (Garilli et al. 2014). Although these uncertainties are not propagated into the KS tests, the large sample sizes and modest typical errors ensure that the statistical significance of the distribution differences remains robust.
3.2. The MBH − M⋆ relation of different AGN populations in dwarf galaxies
In this section we examine the relationship between MBH and M⋆ and the log(MBH/M⋆) ratio as a function of redshift and M⋆ for different AGN populations hosted in dwarf galaxies. Figure 4 present the MBH versus M⋆. Small symbols represent individual measurements, while larger markers show the median black hole masses within stellar mass bins of width 0.25 dex. Error bars correspond to the standard error of the mean (1 σ) in each stellar mass bin, computed as the standard deviation divided by the square root of the number of sources in the bin. Solid lines indicate least-squares linear fits to the binned data. We find that fits to the individual sources yield consistent results, and a similarly good agreement is obtained using the more robust Theil-Sen fitting method. The best-fitting relations (least squares on binned data) for each AGN population are
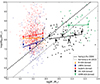 |
Fig. 4. Black hole mass versus stellar mass for the three AGN populations. Small coloured symbols represent individual sources, with distinct shapes and colours indicating the different AGN populations, as shown in the legend. Large symbols indicate median values in stellar mass bins of width 0.25 dex. Error bars correspond to the standard error of the mean (1 σ) in each stellar mass bin, computed as the standard deviation divided by the square root of the number of sources in the bin. Solid lines show least-squares fits to the binned data. Dashed lines correspond to established MBH–M⋆ relations in the local Universe from the literature. Black and green markers denote X-ray-selected AGNs from the XMM-XXL and 4XMM surveys, respectively, restricted to the same redshift range as our sample (0.5 < z < 0.9). Corresponding solid lines show the best-fit relations for these X-ray AGN samples. |
The quoted uncertainties on the slope and intercept reflect the standard error of the linear regression (computed using scipy.stats.linregress). These values indicate the robustness of the trends for each AGN type: the relatively small errors for Seyferts and IR AGNs suggest well-constrained correlations, while the larger uncertainties for LINERs reflect their more scattered distribution in the MBH–M⋆ plane, possibly due to intrinsic diversity or measurement limitations.
We observe that, at fixed M⋆, Seyfert galaxies tend to host more massive black holes than LINERs. This indicates that Seyferts may lie on a different MBH–M⋆ scaling relation, potentially reflecting earlier or more rapid SMBH growth histories. In contrast, LINERs exhibit a steeper MBH–M⋆ relation, indicating a stronger coupling between black hole and stellar mass in this population. This trend is reminiscent of the steeper local scaling relations observed in bulge-dominated or quenched galaxies (e.g. Häring & Rix 2004; Kormendy & Ho 2013, dashed lines). IR-selected AGNs display a flatter relation overall, aligning more closely with Seyferts in normalization but showing little dependence on stellar mass, possibly reflecting a different fuelling mode or evolutionary stage.
4. Discussion
The AGN populations examined in this work are selected using distinct diagnostics, each sensitive to different aspects of black hole accretion and host galaxy conditions. Seyferts, characterized by strong high-ionization lines, are generally associated with radiatively efficient accretion onto SMBHs, likely fuelled by cold gas inflows or internal dynamical processes such as bars and minor mergers (e.g. Kewley et al. 2006; Ellison et al. 2011; Heckman & Best 2014). In contrast, LINERs exhibit low-ionization emission-line spectra, consistent with radiatively inefficient accretion (Ho 2008) or alternative ionizing sources such as shocks or post-asymptotic giant branch stars (e.g. Heckman et al. 1989; Sarzi et al. 2010; Singh et al. 2013; Belfiore et al. 2016). Their host galaxies tend to be older, more massive, and more passive in terms of star formation (Cid Fernandes et al. 2011; Gavazzi et al. 2018). IR-selected AGNs, identified via WISE mid-IR colours, trace hot dust emission from obscured accretion activity (Stern et al. 2012; Assef et al. 2013). This selection is particularly sensitive to heavily obscured and possibly Compton-thick AGN phases (Donley et al. 2012; Hickox & Alexander 2018).
Our comparison of SFRnorm as a function of AGN power, traced by [OIII] luminosity, reveals several systematic trends (top-left panel of Fig. 3). All three AGN populations show suppressed star formation relative to non-AGN star-forming galaxies at low L[OIII], with SFRnorm < 1. As L[OIII] increases, SFRnorm rises and eventually exceeds unity, albeit at different luminosity thresholds. These thresholds likely reflect differences in accretion modes, dust obscuration, selection biases, and potentially evolutionary stages.
The low L[OIII] values in IR AGNs may under-represent their true accretion power, as the optical [OIII] line is more affected by dust extinction than mid-IR emission. Therefore, the observed [OIII] luminosity in IR AGNs may significantly underestimate the intrinsic AGN power. As a result, the luminosity threshold at which SFRnorm begins to rise may appear at lower observed L[OIII] than its true, intrinsic value. The IR AGN population may represent an early or dust-enshrouded AGN phase, where SMBH accretion and star formation co-occur in a gas-rich environment, consistent with the high SFRnorm observed at high L[OIII].
In contrast, LINERs likely include a mixture of weakly accreting AGN and non-AGN sources powered by shocks or old stellar populations, leading to their overall lower SFRnorm. The shallow increase in SFRnorm at low luminosities may be driven by a small subset of true AGNs in the LINER population that become detectable near log L[OIII] ∼ 41.
Examining SFRnorm as a function of black hole mass (top-right panel of Fig. 3), we find that LINERs display values broadly consistent with unity across the entire MBH range, suggesting no strong dependence of star formation on black hole mass in this population. Seyferts show a modest increase in SFRnorm with MBH, although values remain near unity, particularly at log(MBH/M⊙) > 8. IR AGNs exhibit a more pronounced positive trend, with higher MBH associated with enhanced SFRnorm, potentially reflecting greater gas availability or more efficient star formation in dust-obscured systems. These results align with previous findings for X-ray-selected AGNs, which also indicate a weak but positive correlation between star formation and black hole mass (Mountrichas & Buat 2023).
Environmental density can influence gas availability and galaxy interactions. In our sample, SFRnorm shows no strong or systematic dependence on local overdensity, with LINERs, Seyferts, and IR AGNs exhibiting broadly similar trends across the range of log(1 + δ) (bottom-left panel of Fig. 3). If any differences exist, they are subtle and could be masked by scatter or selection effects. This suggests that, within the observed density range, the large-scale environment plays a lesser role than the internal galaxy properties or AGN type in regulating starformation.
We also examined stellar population ages, as traced by the D4000 index (bottom-right panel of Fig. 3). LINERs and IR AGNs host older stellar populations (median D4000 ≈ 1.18–1.19), while Seyfert hosts are slightly younger (D4000 ≈ 1.14). A KS test confirms these differences are statistically significant (p < 0.01 in all cases), supporting a picture in which LINERs are more evolved and possibly in a post-starburst phase.
Our analysis of the MBH–M⋆ relation and the evolution of the log(MBH/M⋆) ratio across different AGN populations offers insights into the co-evolution of black holes and their host galaxies in low-mass systems. The diversity in scaling relations among LINERs, Seyferts, and IR-selected AGNs suggests that the nature and efficiency of black hole growth are closely linked to both the AGN accretion mode and host galaxy conditions.
Seyferts have elevated black hole masses at fixed stellar mass compared to LINERs, suggesting that they may lie on a different MBH–M⋆ scaling relation (Fig. 4). This offset could reflect earlier black hole growth episodes or differences in black hole fuelling efficiency. The interpretation is consistent with their younger stellar populations and higher SFRnorm. The relatively flat MBH–M⋆ relation for Seyferts and IR AGNs may indicate a decoupling between black hole and stellar mass growth at low masses, potentially driven by intermittent fuelling or bursty star formation. In contrast, the steeper relation observed for LINERs implies a tighter coupling between MBH and M⋆, suggestive of co-evolution under more stable or feedback-regulated conditions. These results are in line with local observations showing that quenched, bulge-dominated galaxies tend to follow steeper MBH–M⋆ relations (e.g. Häring & Rix 2004; Kormendy & Ho 2013).
We should note though that the MBH for the sources used in our analysis are estimated using narrow emission lines and bolometric corrections (see Sect. 2.4). While this approach enables MBH estimates in the absence of broad lines, it is inherently less direct than virial methods and subject to additional uncertainties. Specifically, it relies on extinction corrections, assumptions about bolometric luminosities, and the calibration of empirical scaling relations, all of which can introduce scatter. These factors may contribute to the observed dispersion in the MBH–M⋆ relation, particularly for lower-mass systems where the underlying scaling may already be more uncertain.
In addition to the dwarf galaxy AGN populations, in Fig. 4, we also plot the MBH–M⋆ relation for X-ray-selected AGNs hosted in more massive galaxies, using the 4XMM and XMM-XXL samples, presented in Mountrichas et al. (2024d) and Mountrichas (2023). We restricted both datasets to the same redshift range as that used for the AGN populations in dwarf galaxies (0.5 < z < 0.9). The 4XMM sample includes 59 AGNs with median ![Mathematical equation: $ \log\,[L_{X}(\mathrm{erg,s}^{-1})] = 44.8 $](/articles/aa/full_html/2025/10/aa55697-25/aa55697-25-eq5.gif) , for which black hole masses are derived from SDSS spectroscopy and are likely dominated by optical quasi-stellar objects (Wu & Shen 2022). We also included 124 X-ray detected AGNs from XMM-XXL (Pierre et al. 2016; Menzel et al. 2016), with a median
, for which black hole masses are derived from SDSS spectroscopy and are likely dominated by optical quasi-stellar objects (Wu & Shen 2022). We also included 124 X-ray detected AGNs from XMM-XXL (Pierre et al. 2016; Menzel et al. 2016), with a median ![Mathematical equation: $ \log\,[L_{X}(\mathrm{erg,s}^{-1})] = 43.7 $](/articles/aa/full_html/2025/10/aa55697-25/aa55697-25-eq6.gif) . The best-fitting relations (least squares on binned data) for the two X-ray AGN populations are
. The best-fitting relations (least squares on binned data) for the two X-ray AGN populations are
We find that 4XMM AGNs exhibit systematically higher MBH at fixed M⋆ compared to XMM-XXL AGNs. This offset may be linked to differences in accretion properties. Given their higher X-ray luminosities, the 4XMM AGNs may be radiating at higher Eddington ratios (i.e. closer to their Eddington limit; e.g. Aird et al. 2012; Lusso & Risaliti 2016), which could imply either more actively accreting black holes or intrinsically more massive black holes for the same host mass. In contrast, the lower luminosities of XMM-XXL AGNs may reflect a more quiescent accretion phase or a population caught at a different stage of growth. Although the two samples are selected using different criteria, they collectively help trace the MBH–M⋆ relation towards higher stellar masses and underscore how AGN selection effects can shape observed scaling relations.
Similar results to those of our optically selected AGNs are reported by Mezcua et al. (2023), who analysed the MBH–M⋆ relation for seven broad-line AGNs in dwarf galaxies from the VIPERS survey, six of which are also X-ray detected. When placed on the MBH–M⋆ plane, these AGNs occupy a similar region to the three AGN populations examined in our study, reinforcing the consistency of our findings across different selection methods (see their Fig. 1).
In the top panel of Fig. 5, we investigate how the log(MBH/M⋆) ratio evolves with redshift. Seyferts consistently exhibit higher black hole-to-stellar mass ratios compared to LINERs, primarily due to their more massive black holes. IR-selected AGNs lie between these two populations. For all three AGN types, the log(MBH/M⋆) ratio appears roughly constant over the redshift range probed by our sample, implying that the balance between black hole and stellar mass is preserved over 0.5 < z < 0.9 in dwarf hosts. We find median values of log(MBH/M⋆) equal to −1.25 for Seyferts, −1.59 for IR AGNs and −1.80 for LINERs. Notably, these values are significantly elevated compared to those of more massive X-ray-selected AGNs within the same redshift interval (i.e. 0.5 < z < 0.9, with medians of −2.43 for 4XMM AGNs and −2.70 for XMM-XXL AGNs (solid line; Mountrichas 2023), as well as compared to the typical ratio observed in local, inactive galaxies (e.g. Häring & Rix 2004; Kormendy & Ho 2013). This offset could indicate that dwarf AGNs undergo more rapid black hole growth relative to their stellar content, consistent with the idea that black hole seeding and early growth precede significant stellar mass buildup in low-mass systems (e.g. Mountrichas 2023).
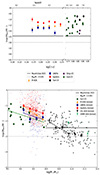 |
Fig. 5. Evolution of the black hole–to–stellar mass ratio. Top: log(MBH/M⋆) versus redshift for the three AGN populations in this study, with high-redshift AGNs (z > 4) from the literature shown for comparison. Bottom: log(MBH/M⋆) versus stellar mass, including high-redshift dwarf AGNs (Sun et al. 2025b) and X-ray AGNs from the XXL and 4XMM surveys. Dashed lines show linear fits to the binned data; for XXL AGNs, the fit is limited to log(M⋆/M⊙) < 11. Solid and dashed horizontal lines indicate the average ratio for XMM-XXL AGNs at z < 2 (Mountrichas 2023) and for local inactive galaxies, respectively. |
A notable fraction of our AGN host galaxies exhibit MBH/M⋆ ratios exceeding 0.1, particularly within the LINER and Seyfert AGN populations (20–25%). While these values may initially appear extreme, similar ratios have been reported in the literature for low-mass systems hosting actively accreting black holes. For example, Mezcua et al. (2023) identified broad-line AGNs in dwarf galaxies from the VIPERS survey with MBH/M⋆ values up to and beyond 0.1 (see their Fig. 2), in line with the range observed in our study. Such over-massive black holes may result from early, rapid SMBH growth episodes or from selection effects favouring systems with relatively low stellar masses but substantial nuclear activity. Additional support for high MBH/M⋆ ratios has been provided by other studies of optically and X-ray-selected AGNs in the low-mass regime (e.g. Reines & Volonteri 2015). These findings suggest that elevated MBH/M⋆ ratios in low-mass AGN hosts are not necessarily unphysical outliers but instead represent a real, albeit extreme, component of the black hole–galaxy co-evolution landscape.
To further investigate the diversity of AGN populations in dwarf galaxies, we quantified the scatter in MBH at fixed stellar mass. We computed the standard deviation of log(MBH) within M⋆ bins for each AGN sample. LINERs and Seyferts exhibit the largest scatter, with median values of 0.93 and 0.81 dex, respectively, significantly exceeding those measured for X-ray-selected AGNs (0.51 dex for 4XMM, 0.48 dex for XXL) and for IR AGNs (0.22 dex).
This enhanced scatter could reflect a combination of factors. First, narrow line based black hole mass estimates, particularly those relying on [OIII] luminosities, are subject to larger uncertainties and intrinsic scatter than broad-line methods typically used for quasi-stellar objects. Second, dwarf galaxies likely exhibit greater stochasticity in their black hole fuelling and growth histories, due to shallower potential wells, bursty star formation, and environmental effects. The fact that the scatter is substantially lower in the IR AGN and X-ray AGN samples, which may select more homogeneous or more actively accreting populations, supports the interpretation that part of the scatter in optical AGNs reflects real physical diversity rather than solely measurement uncertainty.
In the same figure, we include high-redshift Seyfert galaxies from Sun et al. (2025b) at z > 4 with stellar masses in the range 8 < log(M⋆/M⊙) < 10 (see their Table 1). We also show three z ∼ 6 quasars from Yue et al. (2024), for which reliable stellar masses are available (i.e. not upper limits): log(M⋆/M⊙) = 9.81, 10.14, and 10.64 (see their Tables 1 and 3). Additionally, we plot two quasars at z > 6 from Ding et al. (2023) with log(M⋆/M⊙) = 10.53 and 11.11. Interestingly, these high-redshift sources exhibit log(MBH/M⋆) values comparable to those of the low-mass AGN populations in our sample. Specifically, Seyferts from Sun et al. (2025b) at z > 4 exhibit a median log(MBH/M⋆) of −1.50, closely matching the values found for Seyferts and IR AGNs in our low-redshift sample. Luminous quasars from Yue et al. (2024) and Ding et al. (2023) at z > 6 show more variation, with median values of −0.75 and −2.10, respectively (top panel of Fig. 5). While the Yue et al. sample appears to host relatively over-massive black holes, the Ding et al. quasars are more consistent with the X-ray-selected AGNs in our sample. These results suggest that a high black hole-to-stellar mass ratio is a generic feature of low-mass or early-phase systems, persisting across cosmic time. The least-squares fit to the Sun et al. (2025b) sample reinforces this point, with a similar slope and normalization to the low-redshift dwarf Seyferts (bottom panel of Fig. 5).
The observed flatness of the log(MBH/M⋆) ratio with redshift for dwarf galaxy AGNs contrasts with some theoretical expectations that predict evolving scaling relations due to differential growth of black holes and their host galaxies over cosmic time. Semi-analytic and cosmological hydrodynamic simulations that incorporate AGN feedback and hierarchical assembly often anticipate a gradual decrease in the black hole-to-stellar mass ratio at higher redshifts, particularly in low-mass systems where stellar mass builds up faster than black hole mass (e.g. Volonteri & Reines 2016; Habouzit et al. 2021; Anglés-Alcázar et al. 2017; Trinca et al. 2022; Koudmani et al. 2024). These models suggest that black hole growth in low-mass halos is either delayed by inefficient accretion or suppressed by stellar or AGN feedback. In contrast, our results indicate that within the redshift range probed by our sample (0.5 < z < 0.9), dwarf AGNs exhibit elevated mass ratios that remain approximately constant with redshift. This apparent stability may challenge models that rely on delayed seeding, low accretion efficiencies, or strong feedback in the early stages of dwarf galaxy evolution.
In the bottom panel of Fig. 5, we present the log(MBH/M⋆) ratio as a function of stellar mass. The dashed lines correspond to least-squares fits applied to the binned data for the three AGN populations in our study, as well as to the individual measurements of the high-redshift Seyferts from Sun et al. (2025b). Seyferts and IR AGNs exhibit a clear decline in log(MBH/M⋆) with increasing M⋆, while the trend for LINERs is less robust and may be influenced by a single low-mass bin. A similar trend (decline) is observed for the high-redshift Seyferts in dwarf galaxies reported by Sun et al. (2025b). Interestingly, X-ray-selected AGNs from the XXL survey at z < 2 also follow this declining trend for log(M⋆/M⊙) < 11. At higher stellar masses, however, the log(MBH/M⋆) ratio flattens and reaches values consistent with those observed in local, inactive galaxies (dotted line), both for the XXL and 4XMM AGN samples. This decline may reflect an early phase of accelerated black hole growth relative to the host galaxy, followed by stellar mass assembly that gradually reduces the MBH/M⋆ ratio towards values typical of local, massive, inactive galaxies. While the data may suggest a decreasing trend in MBH/M⋆ with increasing M⋆, particularly when comparing the XMM-XXL and 4XMM samples, we emphasize that this trend remains tentative due to differences in AGN selection and the inherent uncertainties in black hole mass estimates. Nevertheless, if this trend is real, the proposed interpretation aligns with predictions from cosmological simulations, which show that black holes in low-mass halos tend to grow rapidly at early times, while the build-up of stellar mass continues over longer timescales (e.g. Habouzit et al. 2017; Anglés-Alcázar et al. 2017; Dubois et al. 2021). For LINERs, however, the trend is less clear, with limited dynamic range and larger scatter possibly masking any underlying correlation. At higher stellar masses (log(M⋆/M⊙)≳10.8), the relation flattens and converges towards the canonical local value of log(MBH/M⋆)∼ − 3.
When incorporating MBH estimates from X-ray AGNs and optical quasars, we emphasize that these typically include broad-line (Type 1) sources, for which MBH is derived using single-epoch virial estimators based on the widths of broad emission lines. These virial methods probe the dynamics of the broad-line region and are fundamentally different from the narrow-line diagnostics used in our Seyfert, LINER, and IR AGN sample. As such, direct comparisons between the two must be interpreted with caution, as each method carries its own systematic uncertainties and probes different physical scales. The scatter and possible offsets in MBH–M⋆ space may in part reflect these methodological differences, in addition to any underlying physical diversity in AGN fuelling or host galaxy properties.
Taken together, our results suggest that the diversity in AGN populations hosted by dwarf galaxies cannot be explained solely by a single evolutionary sequence. If IR AGNs, Seyferts, and LINERs represented consecutive phases of black hole growth (e.g. IR AGNs → Seyferts, and → LINERs), one would expect a smooth increase in stellar mass and perhaps black hole mass along this progression. However, our findings challenge this view. Instead, they point towards a bimodal framework, in which different AGN types can arise from distinct physical conditions and triggering mechanisms. IR-selected AGNs may trace early, dust-enshrouded black hole growth episodes–possibly merger-driven and embedded in gas-rich environments. Seyferts could represent ongoing SMBH fuelling via secular processes or disk instabilities, consistent with their moderate-to-high accretion rates and elevated star formation. LINERs, in contrast, appear to be hosted by quenched, massive galaxies with older stellar populations and may result from radiatively inefficient accretion, potentially fuelled by hot halo gas or residual material from earlier activity. While these trends can be interpreted as snapshots along an evolutionary pathway, they may also reflect fundamental differences in origin, where Seyferts and LINERs arise from distinct fuelling modes and galaxy environments (e.g. Mountrichas et al. 2024b).
5. Summary
In this work we analysed a sample of 787 Seyfert galaxies, 263 LINERs, and 1 058 star-forming galaxies selected using the BPT diagnostic diagram, as well as 393 IR AGNs identified through WISE mid-IR colour selection that fall outside the BPT classification. All AGNs are located in dwarf galaxies with log(M⋆/M⊙) < 10, are drawn from the VIPERS catalogue, and are within the redshift range 0.5 < z < 0.9 (see Siudek et al. 2023, for sample selection details).
To quantify the impact of AGN activity on star formation, we employed the SFRnorm parameter, defined as the ratio of the SFR in an AGN host to that of a star-forming, non-AGN galaxy of a similar stellar mass and redshift. We explored how SFRnorm varies as a function of AGN power (using [OIII] luminosity as a proxy), black hole mass, and large-scale environment (via local overdensity measurements). We also incorporated additional host galaxy properties, including the 4000Å break strength (D4000), to place AGN activity within the broader context of galaxy structure and evolution. Based on this multi-dimensional analysis, we draw the following mainconclusions:
-
All AGN populations exhibit suppressed star formation (SFRnorm < 1) at low [OIII] luminosities relative to matched star-forming galaxies. This suggests AGN activity can suppress star formation in this regime or that AGNs are preferentially found in already quenching galaxies.
-
SFRnorm increases with L[OIII] for all AGN types, crossing unity at different luminosity thresholds. This pattern may reflect differences in accretion modes, feedback strength, or selection biases across populations.
-
The SFRnorm shows distinct behaviours across AGN populations as a function of black hole mass: LINERs display an approximately flat trend with values slightly below but broadly consistent with unity; Seyferts exhibit a mild increase in SFRnorm with MBH; and IR-selected AGNs show a more pronounced upward trend. For both IR and X-ray AGNs, SFRnorm exceeds unity at higher black hole masses, suggesting increased star formation in these systems.
-
SFRnorm remains relatively flat across all environmental densities for Seyferts, with values slightly below unity. LINERs and IR AGNs show a possible rise in SFRnorm at the highest overdensities, but this is driven by a single bin and should be interpreted with caution. Overall, there is no strong evidence of a systematic dependence of SFRnorm on environment in any AGN population.
-
LINERs and IR AGNs have slightly older stellar populations (median D4000 ∼ 1.18–1.19) compared to Seyferts (D4000 ∼ 1.14).
We further examined the relationship between black hole mass and stellar mass, as well as the evolution of their ratio as a function of redshift and stellar mass across the three AGN populations. To place our findings in a broader context, we compared them with results from previous X-ray-selected AGN studies and incorporated high-redshift AGN samples (z ∼ 4–7). This enabled us to extend the analysis towards more massive galaxies (10 < log(M⋆/M⊙) < 12) and earlier cosmic epochs, providing a unified view of black hole–galaxy co-evolution across a wide range of masses and redshifts. The main conclusions from this part of our analysis are as follows:
-
At fixed stellar mass, Seyfert galaxies tend to host more massive black holes than LINERs, resulting in higher median log(MBH/M⋆) ratios, with IR AGNs falling in between. Compared to our AGN populations, X-ray-selected AGNs from the 4XMM and XMM-XXL surveys have systematically lower log(MBH/M⋆) ratios, suggesting differences in selection or evolutionary stage, and highlighting the importance of AGN classification in interpreting black hole–host scaling relations.
-
The MBH–M⋆ relation slope is steepest for LINERs, suggesting a stronger coupling between black hole and stellar mass in these sources, reminiscent of bulge-dominated, quenched galaxies.
-
Seyferts and IR AGNs in dwarf galaxies show a declining trend in log(MBH/M⋆) with increasing stellar mass, consistent with a scenario in which black hole growth initially outpaces stellar mass assembly in low-mass systems. X-ray AGNs at similar redshifts exhibit a comparable decline up to log(M⋆/M⊙)∼11, above which the ratio flattens towards values typical of local, inactive galaxies. In contrast, LINERs do not show a clear trend, possibly due to a limited dynamic range or larger scatter in the data.
-
High-redshift AGNs (z > 4), including Seyferts from Sun et al. (2025a) and quasars from Ding et al. (2023) and Yue et al. (2024), have log(MBH/M⋆) values comparable to those of our dwarf AGN populations, suggesting that elevated black hole mass fractions are not unique to the local Universe but extend to the early phases of galaxy evolution.
In summary, our joint analysis of star formation activity, black hole mass, and host galaxy properties reveals a diverse set of AGN evolutionary pathways within dwarf galaxies. This diversity likely reflects a combination of physical processes. For instance, LINERs have older stellar populations and lower SFRnorm values, consistent with evolved systems with limited cold gas supply. In contrast, Seyferts have higher black hole masses at fixed stellar mass and elevated SFRnorm, suggesting more active black hole growth in gas-rich environments. IR-selected AGNs, with their flatter MBH–M⋆ relation and intermediate D4000 values, may represent obscured systems undergoing a transitional phase of growth. These differences point to a complex interplay between gas availability, obscuration, feedback strength, and environmental factors. The use of complementary AGN selection techniques, each probing different accretion phases, underscores the need for a multi-faceted approach to fully capture the range of AGN activity. Future spectroscopic and multi-wavelength surveys, particularly those enabling morphological and spatially resolved analysis such as DESI, will provide critical constraints on these evolutionary scenarios across a broader parameter space.
Acknowledgments
GM acknowledges funding from grant PID2021-122955OB-C41 funded by MCIN/AEI/10.13039/501100011033 and by “ERDF/EU”. M.S. acknowledges support by the State Research Agency of the Spanish Ministry of Science and Innovation under the grants ‘Galaxy Evolution with Artificial Intelligence’ (PGC2018-100852-A-I00) and ‘BASALT’ (PID2021-126838NB-I00) and the Polish National Agency for Academic Exchange (Bekker grant BPN/BEK/2021/1/00298/DEC/1). This work was partially supported by the European Union’s Horizon 2020 Research and Innovation program under the Maria Sklodowska-Curie grant agreement (No. 754510).
References
- Aird, J., Coil, A. L., Moustakas, J., et al. 2012, ApJ, 746, 90 [CrossRef] [Google Scholar]
- Anglés-Alcázar, D., Faucher-Giguère, C.-A., Kereš, D., et al. 2017, MNRAS, 470, 4698 [CrossRef] [Google Scholar]
- Arjona-Gálvez, E., Di Cintio, A., & Grand, R. J. J. 2024, A&A, 690, A286 [NASA ADS] [CrossRef] [EDP Sciences] [Google Scholar]
- Assef, R. J., Stern, D., Kochanek, C. S., et al. 2013, ApJ, 772, 26 [Google Scholar]
- Baldassare, V. F., Reines, A. E., Gallo, E., et al. 2016, ApJ, 829, 57 [NASA ADS] [CrossRef] [Google Scholar]
- Baldassare, V. F., Geha, M., & Greene, J. 2020, ApJ, 896, 10 [NASA ADS] [CrossRef] [Google Scholar]
- Baldry, I. K., Driver, S. P., Loveday, J., et al. 2012, MNRAS, 421, 621 [NASA ADS] [Google Scholar]
- Baldwin, J. A., Phillips, M. M., & Terlevich, R. 1981, PASP, 93, 5 [Google Scholar]
- Baron, D., & Ménard, B. 2019, MNRAS, 487, 3404 [CrossRef] [Google Scholar]
- Belfiore, F., Maiolino, R., Maraston, C., et al. 2016, MNRAS, 461, 3111 [Google Scholar]
- Bernhard, E., Grimmett, L. P., Mullaney, J. R., et al. 2019, MNRAS, 483, L52 [NASA ADS] [CrossRef] [Google Scholar]
- Birchall, K. L., Watson, M. G., & Aird, J. 2020, MNRAS, 492, 2268 [NASA ADS] [CrossRef] [Google Scholar]
- Bruzual, G., & Charlot, S. 2003, MNRAS, 344, 1000 [NASA ADS] [CrossRef] [Google Scholar]
- Chabrier, G. 2003, PASP, 115, 763 [Google Scholar]
- Cheung, E., Trump, J. R., Athanassoula, E., et al. 2015, MNRAS, 447, 506 [NASA ADS] [CrossRef] [Google Scholar]
- Cid Fernandes, R., Stasinska, G., Mateus, A., & Vale Asari, N. 2011, MNRAS, 413, 1687 [NASA ADS] [CrossRef] [Google Scholar]
- Cristello, N., Zou, F., Brandt, W. N., et al. 2024, ApJ, 962, 156 [NASA ADS] [CrossRef] [Google Scholar]
- Cucciati, O., Davidzon, I., Bolzonella, M., et al. 2017, A&A, 602, A15 [NASA ADS] [CrossRef] [EDP Sciences] [Google Scholar]
- Ding, X., Onoue, M., Silverman, J. D., et al. 2023, Nature, 621, 51 [NASA ADS] [CrossRef] [Google Scholar]
- Donley, J. L., Koekemoer, A. M., Brusa, M., et al. 2012, ApJ, 748, 142 [Google Scholar]
- Dubois, Y., Beckmann, R., Bournaud, F., et al. 2021, A&A, 651, A109 [NASA ADS] [CrossRef] [EDP Sciences] [Google Scholar]
- Ellison, S. L., Patton, D. R., Mendel, J. T., & Scudder, J. M. 2011, MNRAS, 418, 2043 [NASA ADS] [CrossRef] [Google Scholar]
- Eróstegui, A., Mezcua, M., Siudek, M., Domínguez Sánchez, H., & Rodríguez Morales, V. 2025, A&A, 699, A330 [NASA ADS] [CrossRef] [EDP Sciences] [Google Scholar]
- Ferrarese, L., & Merritt, D. 2000, ApJ, 539, 9 [Google Scholar]
- Ferré-Mateu, A., Mezcua, M., & Barrows, R. S. 2021, MNRAS, 506, 4702 [NASA ADS] [CrossRef] [Google Scholar]
- Florez, J., Jogee, S., Sherman, S., et al. 2020, MNRAS, 497, 3273 [NASA ADS] [CrossRef] [Google Scholar]
- Franx, M., van Dokkum, P. G., Schreiber, N. M. F., et al. 2008, ApJ, 688, 770 [NASA ADS] [CrossRef] [Google Scholar]
- Garilli, B., Guzzo, L., Scodeggio, M., et al. 2014, A&A, 562, 23 [Google Scholar]
- Gavazzi, G., Consolandi, G., Belladitta, S., Boselli, A., & Fossati, M. 2018, A&A, 615, A104 [NASA ADS] [CrossRef] [EDP Sciences] [Google Scholar]
- Greene, J. E., Strader, J., & Ho, L. C. 2020, ARA&A, 58, 257 [Google Scholar]
- Greene, J. E., Labbe, I., Goulding, A. D., et al. 2024, ApJ, 964, 39 [CrossRef] [Google Scholar]
- Guzzo, L., Scodeggio, M., Garilli, B., et al. 2014, A&A, 566, 108 [Google Scholar]
- Habouzit, M., Volonteri, M., & Dubois, Y. 2017, MNRAS, 468, 3935 [NASA ADS] [CrossRef] [Google Scholar]
- Habouzit, M., Li, Y., Somerville, R. S., et al. 2021, MNRAS, 503, 1940 [NASA ADS] [CrossRef] [Google Scholar]
- Häring, N., & Rix, H.-W. 2004, ApJ, 604, L89 [Google Scholar]
- Heckman, T. M., & Best, P. N. 2014, ARA&A, 52, 589 [Google Scholar]
- Heckman, T. M., Baum, S. A., van Breugel, W. J. M., & McCarthy, P. 1989, ApJ, 338, 48 [Google Scholar]
- Hickox, R. C., & Alexander, D. M. 2018, ARA&A, 56, 625 [Google Scholar]
- Ho, L. C. 2008, ARA&A, 46, 475 [Google Scholar]
- Hviding, R. E., Hainline, K. N., Rieke, M., et al. 2022, AJ, 163, 224 [NASA ADS] [CrossRef] [Google Scholar]
- Ilbert, O., et al. 2006, AAP, 457, 841 [Google Scholar]
- Jahnke, K., et al. 2009, ApJ, 706, 215 [Google Scholar]
- Kaviraj, S., Martin, G., & Silk, J. 2019, MNRAS, 489, L12 [Google Scholar]
- Kewley, L. J., Geller, M. J., & Jansen, R. A. 2004, AJ, 127, 2002 [Google Scholar]
- Kewley, L. J., Groves, B., Kauffmann, G., & Heckman, T. 2006, MNRAS, 372, 961 [Google Scholar]
- Kondapally, R., Best, P. N., Duncan, K. J., et al. 2025, MNRAS, 536, 554 [Google Scholar]
- Kormendy, J., & Ho, L. C. 2013, ARA&A, 51, 511 [Google Scholar]
- Koudmani, S., Somerville, R. S., Sijacki, D., et al. 2024, MNRAS, 532, 60 [Google Scholar]
- Koutoulidis, L., Mountrichas, G., Georgantopoulos, I., Pouliasis, E., & Plionis, M. 2022, A&A, 658, A35 [NASA ADS] [CrossRef] [EDP Sciences] [Google Scholar]
- Kristensen, M. T., Pimbblet, K., & Penny, S. 2020, MNRAS, 496, 2577 [Google Scholar]
- Krywult, J., Tasca, L. A. M., Pollo, A., et al. 2017, A&A, 598, A120 [NASA ADS] [CrossRef] [EDP Sciences] [Google Scholar]
- Lamareille, F. 2010, A&A, 509, A53 [CrossRef] [EDP Sciences] [Google Scholar]
- Le Fèvre, O., Saisse, M., Mancini, D., et al. 2003, in Instrument Design and Performance for Optical/Infrared Ground-based Telescopes, eds. M. Iye, & A. F. M. Moorwood, SPIE Conf. Ser., 4841, 1670 [CrossRef] [Google Scholar]
- Lusso, E., & Risaliti, G. 2016, ApJ, 819, 154 [Google Scholar]
- Magorrian, J., Tremaine, S., Richstone, D., et al. 1998, AJ, 115, 2285 [Google Scholar]
- Manzano-King, C. M., & Canalizo, G. 2020, MNRAS, 498, 4562 [Google Scholar]
- Manzano-King, C. M., Canalizo, G., & Sales, L. V. 2019, ApJ, 884, 54 [NASA ADS] [CrossRef] [Google Scholar]
- Masoura, V. A., Mountrichas, G., Georgantopoulos, I., et al. 2018, A&A, 618, 31 [Google Scholar]
- Masoura, V. A., Mountrichas, G., Georgantopoulos, I., & Plionis, M. 2021, A&A, 646, A167 [EDP Sciences] [Google Scholar]
- Menzel, M.-L., Merloni, A., Georgakakis, A., et al. 2016, MNRAS, 457, 110 [Google Scholar]
- Mezcua, M. 2017, Int. J. Mod. Phys. D, 26, 1730021 [Google Scholar]
- Mezcua, M., & Domínguez Sánchez, H. 2020, ApJ, 898, L30 [Google Scholar]
- Mezcua, M., Civano, F., Fabbiano, G., Miyaji, T., & Marchesi, S. 2016, ApJ, 817, 20 [Google Scholar]
- Mezcua, M., Civano, F., Marchesi, S., et al. 2018, MNRAS, 478, 2576 [NASA ADS] [CrossRef] [Google Scholar]
- Mezcua, M., Siudek, M., Suh, H., et al. 2023, ApJ, 943, L5 [NASA ADS] [CrossRef] [Google Scholar]
- Mezcua, M., Pacucci, F., Suh, H., Siudek, M., & Natarajan, P. 2024, ApJ, 966, L30 [NASA ADS] [CrossRef] [Google Scholar]
- Mountrichas, G. 2023, A&A, 672, A98 [NASA ADS] [CrossRef] [EDP Sciences] [Google Scholar]
- Mountrichas, G., & Buat, V. 2023, A&A, 679, A151 [NASA ADS] [CrossRef] [EDP Sciences] [Google Scholar]
- Mountrichas, G., Buat, V., Georgantopoulos, I., et al. 2021a, A&A, 653, A70 [NASA ADS] [CrossRef] [EDP Sciences] [Google Scholar]
- Mountrichas, G., Buat, V., Yang, G., et al. 2021b, A&A, 653, A74 [NASA ADS] [CrossRef] [EDP Sciences] [Google Scholar]
- Mountrichas, G., Buat, V., Yang, G., et al. 2022a, A&A, 663, A130 [NASA ADS] [CrossRef] [EDP Sciences] [Google Scholar]
- Mountrichas, G., Masoura, V. A., Xilouris, E. M., et al. 2022b, A&A, 661, A108 [NASA ADS] [CrossRef] [EDP Sciences] [Google Scholar]
- Mountrichas, G., Masoura, V. A., Corral, A., & Carrera, F. J. 2024a, A&A, 683, A143 [NASA ADS] [CrossRef] [EDP Sciences] [Google Scholar]
- Mountrichas, G., Ruiz, A., Georgantopoulos, I., et al. 2024b, A&A, 688, A79 [NASA ADS] [CrossRef] [EDP Sciences] [Google Scholar]
- Mountrichas, G., Siudek, M., & Cucciati, O. 2024c, A&A, 686, A229 [NASA ADS] [CrossRef] [EDP Sciences] [Google Scholar]
- Mountrichas, G., Viitanen, A., Carrera, F. J., et al. 2024d, A&A, 683, A172 [NASA ADS] [CrossRef] [EDP Sciences] [Google Scholar]
- Moutard, T., Arnouts, S., Ilbert, O., et al. 2016, A&A, 590, A103 [NASA ADS] [CrossRef] [EDP Sciences] [Google Scholar]
- Mullaney, J. R., Alexander, D. M., Aird, J., et al. 2015, MNRAS, 453, L83 [Google Scholar]
- Muzzin, A., Marchesini, D., Stefanon, M., et al. 2013, ApJ, 777, 18 [NASA ADS] [CrossRef] [Google Scholar]
- Nandi, P., Stalin, C. S., Saikia, D. J., et al. 2023, ApJ, 950, 81 [NASA ADS] [CrossRef] [Google Scholar]
- Netzer, H. 2009, MNRAS, 399, 1907 [CrossRef] [Google Scholar]
- Pardo, K., Goulding, A. D., Greene, J. E., et al. 2016, ApJ, 831, 203 [NASA ADS] [CrossRef] [Google Scholar]
- Peng, C. Y., Ho, L. C., Impey, C. D., & Rix, H.-W. 2002, AJ, 124, 266 [Google Scholar]
- Penny, S. J., Masters, K. L., Smethurst, R., et al. 2018, MNRAS, 476, 979 [NASA ADS] [CrossRef] [Google Scholar]
- Pierre, M., Pacaud, F., Adami, C., et al. 2016, A&A, 592, 1 [Google Scholar]
- Polimera, M. S., Kannappan, S. J., Richardson, C. T., et al. 2022, ApJ, 931, 44 [NASA ADS] [CrossRef] [Google Scholar]
- Pouliasis, E., Mountrichas, G., Georgantopoulos, I., et al. 2022, A&A, 667, A56 [NASA ADS] [CrossRef] [EDP Sciences] [Google Scholar]
- Pucha, R., Juneau, S., Dey, A., et al. 2025, ApJ, 982, 10 [Google Scholar]
- Reines, A. E., & Volonteri, M. 2015, ApJ, 813, 82 [NASA ADS] [CrossRef] [Google Scholar]
- Reines, A. E., Greene, J. E., & Geha, M. 2013, ApJ, 775, 116 [Google Scholar]
- Reis, I. 2020, AJ, 159, 159 [Google Scholar]
- Rosario, D. J., Santini, P., Lutz, D., et al. 2012, A&A, 545, 18 [Google Scholar]
- Salim, S., Boquien, M., & Lee, J. C. 2018, ApJ, 859, 11 [Google Scholar]
- Santini, P., Rosario, D. J., Shao, L., et al. 2012, A&A, 540, A109 [NASA ADS] [CrossRef] [EDP Sciences] [Google Scholar]
- Sarzi, M., Shields, J. C., Schawinski, K., et al. 2010, MNRAS, 402, 2187 [Google Scholar]
- Scodeggio, M., Guzzo, L., Garilli, B., et al. 2018, A&A, 609, A84 [NASA ADS] [CrossRef] [EDP Sciences] [Google Scholar]
- Setoguchi, K., Ueda, Y., Toba, Y., & Akiyama, M. 2021, ApJ, 909, 188 [NASA ADS] [CrossRef] [Google Scholar]
- Shimizu, T. T., Mushotzky, R. F., Meléndez, M., Koss, M., & Rosario, D. J. 2015, MNRAS, 452, 1841 [NASA ADS] [CrossRef] [Google Scholar]
- Silk, J., & Rees, M. J. 1998, A&A, 331, L1 [NASA ADS] [Google Scholar]
- Singh, R., van de Ven, G., Jahnke, K., et al. 2013, A&A, 558, A43 [NASA ADS] [CrossRef] [EDP Sciences] [Google Scholar]
- Siudek, M., Mezcua, M., & Krywult, J. 2023, MNRAS, 518, 724 [Google Scholar]
- Stern, D., Assef, R. J., Benford, D. J., et al. 2012, ApJ, 753, 30 [Google Scholar]
- Suh, H., Civano, F., Trakhtenbrot, B., et al. 2020, ApJ, 889, 32 [NASA ADS] [CrossRef] [Google Scholar]
- Sun, M., Trump, J. R., Brandt, W. N., et al. 2015, ApJ, 802, 14 [NASA ADS] [CrossRef] [Google Scholar]
- Sun, Y., Lyu, J., Rieke, G. H., et al. 2025a, ApJ, 978, 98 [Google Scholar]
- Sun, Y., Rieke, G. H., Lyu, J., et al. 2025b, ApJ, 983, 165 [Google Scholar]
- Torbaniuk, O., Paolillo, M., D’Abrusco, R., et al. 2024, MNRAS, 527, 12091 [Google Scholar]
- Trinca, A., Schneider, R., Valiante, R., et al. 2022, MNRAS, 511, 616 [NASA ADS] [CrossRef] [Google Scholar]
- Vietri, G., Garilli, B., Polletta, M., et al. 2022, A&A, 659, A129 [NASA ADS] [CrossRef] [EDP Sciences] [Google Scholar]
- Volonteri, M. 2010, A&A Rev., 18, 279 [NASA ADS] [CrossRef] [Google Scholar]
- Volonteri, M., & Reines, A. E. 2016, ApJ, 820, L6 [NASA ADS] [CrossRef] [Google Scholar]
- Wu, Q., & Shen, Y. 2022, ApJS, 263, 42 [NASA ADS] [CrossRef] [Google Scholar]
- Yue, M., Eilers, A.-C., Simcoe, R. A., et al. 2024, ApJ, 966, 176 [NASA ADS] [CrossRef] [Google Scholar]
- Zhang, B., Zou, F., Brandt, W. N., et al. 2025, ApJ, 978, 9 [Google Scholar]
All Figures
|
Fig. 1. Distributions of stellar mass (left) and redshift (right) for the three AGN populations. The mean (μ) and median (med) values for each distribution are indicated in the legends. Vertical lines correspond to mean values. |
| In the text | |
|
Fig. 2. Distributions of sSFRs ( |
| In the text | |
|
Fig. 3. Normalized SFR (SFRnorm) for the three AGN populations as a function of key physical parameters. Top left: SFRnorm versus [OIII] luminosity. Top right: SFRnorm as a function of black hole mass. Bottom left: SFRnorm as a function of environmental density. Bottom right: Distributions of stellar ages, using the D4000 index as a proxy. |
| In the text | |
|
Fig. 4. Black hole mass versus stellar mass for the three AGN populations. Small coloured symbols represent individual sources, with distinct shapes and colours indicating the different AGN populations, as shown in the legend. Large symbols indicate median values in stellar mass bins of width 0.25 dex. Error bars correspond to the standard error of the mean (1 σ) in each stellar mass bin, computed as the standard deviation divided by the square root of the number of sources in the bin. Solid lines show least-squares fits to the binned data. Dashed lines correspond to established MBH–M⋆ relations in the local Universe from the literature. Black and green markers denote X-ray-selected AGNs from the XMM-XXL and 4XMM surveys, respectively, restricted to the same redshift range as our sample (0.5 < z < 0.9). Corresponding solid lines show the best-fit relations for these X-ray AGN samples. |
| In the text | |
|
Fig. 5. Evolution of the black hole–to–stellar mass ratio. Top: log(MBH/M⋆) versus redshift for the three AGN populations in this study, with high-redshift AGNs (z > 4) from the literature shown for comparison. Bottom: log(MBH/M⋆) versus stellar mass, including high-redshift dwarf AGNs (Sun et al. 2025b) and X-ray AGNs from the XXL and 4XMM surveys. Dashed lines show linear fits to the binned data; for XXL AGNs, the fit is limited to log(M⋆/M⊙) < 11. Solid and dashed horizontal lines indicate the average ratio for XMM-XXL AGNs at z < 2 (Mountrichas 2023) and for local inactive galaxies, respectively. |
| In the text | |
Current usage metrics show cumulative count of Article Views (full-text article views including HTML views, PDF and ePub downloads, according to the available data) and Abstracts Views on Vision4Press platform.
Data correspond to usage on the plateform after 2015. The current usage metrics is available 48-96 hours after online publication and is updated daily on week days.
Initial download of the metrics may take a while.