Fig. 1.

Download original image
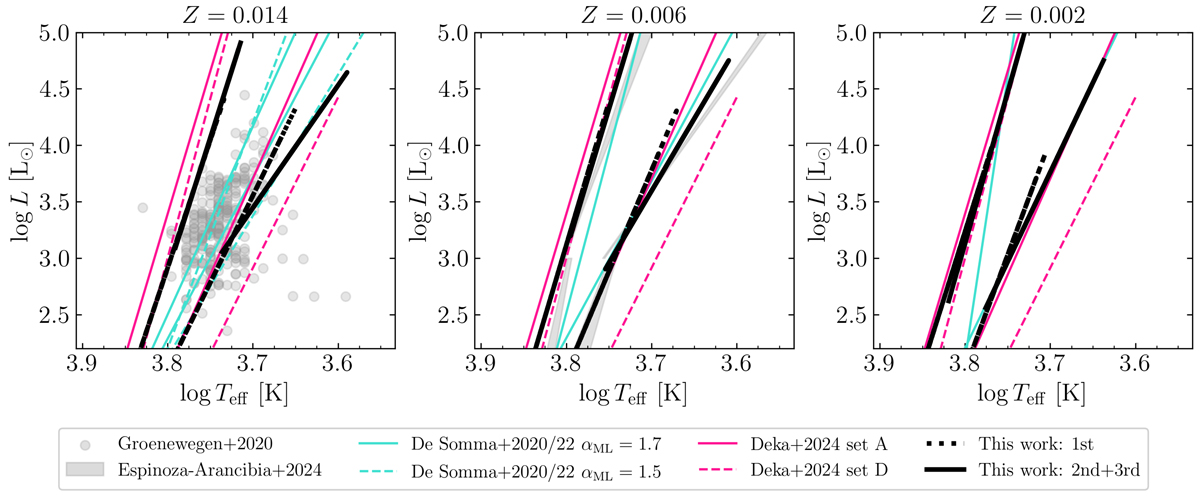
HRDs for metallicities Z = 0.014 (Solar, left), Z = 0.006 (LMC, middle), and Z = 0.002 (SMC, right). Solid black lines show predicted IS boundaries from A16 for the second+third crossings averaged together; dashed black lines show the first crossing. Solid and dashed cyan lines illustrate predicted boundaries from De Somma et al. (2020, 2022, with their case A referred to as a ‘canonical’ mixing-length relation. We note the difference in Z values: 0.020, 0.008, 0.004), for αML = 1.7 and 1.5, respectively. Solid and dashed pink lines show predicted sets A (simple convective model) and D (added radiative cooling, turbulent pressure and flux) from Deka et al. (2024), which estimate the envelopes of instability strips across a large range of metallicities ([M/H] ∈ {0.00, −0.34, −0.75}, namely, Z∈ {0.013, 0.006, 0.002}) and are shown in all panels. Observational estimates of 265 fundamental-mode Galactic classical Cepheids from Groenewegen (2020a) are shown in the left panel. Empirically derived IS boundaries for the LMC from Espinoza-Arancibia et al. (2024) are shown as grey regions in the middle panel.
Current usage metrics show cumulative count of Article Views (full-text article views including HTML views, PDF and ePub downloads, according to the available data) and Abstracts Views on Vision4Press platform.
Data correspond to usage on the plateform after 2015. The current usage metrics is available 48-96 hours after online publication and is updated daily on week days.
Initial download of the metrics may take a while.


