Fig. 10.
Download original image
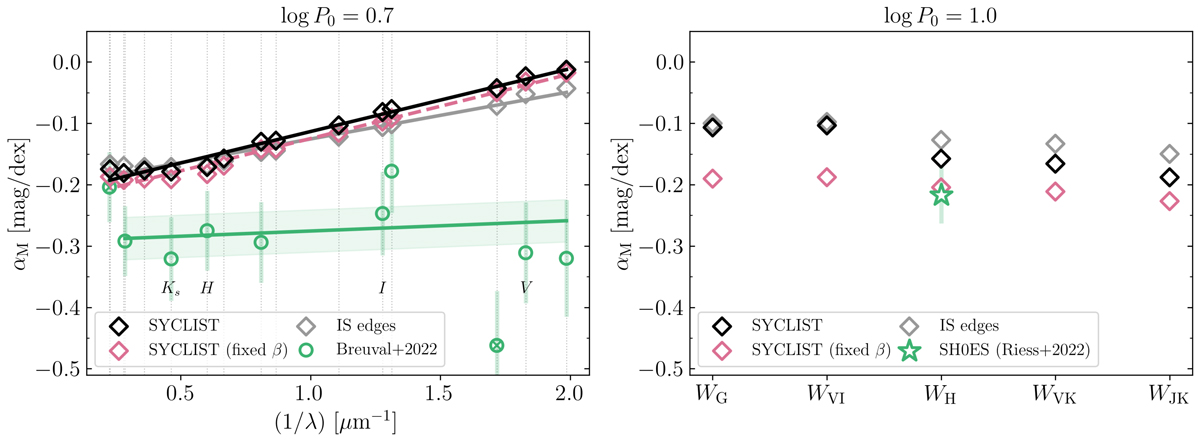
Metallicity effect on the LL intercept, αM, as defined in Eq. (3). The left panel shows αM as a function of the effective wavelength 1/λ for a pivot period of log P0 = 0.7, while the right panel shows the comparison for Wesenheit magnitudes and for log P0 = 1.0. Our predictions based on SYCLIST, letting the LL slope vary or be fixed to that of the LMC, and IS edges are shown in black, pink, and grey, respectively. Observational results from B22 and SH0ES (R22) are shown in green in the left and right panels, respectively. In the left panel, the vertical dotted lines show the location of all the photometric passbands considered and we label some of them to orient the reader.
Current usage metrics show cumulative count of Article Views (full-text article views including HTML views, PDF and ePub downloads, according to the available data) and Abstracts Views on Vision4Press platform.
Data correspond to usage on the plateform after 2015. The current usage metrics is available 48-96 hours after online publication and is updated daily on week days.
Initial download of the metrics may take a while.