Fig. 3.
Download original image
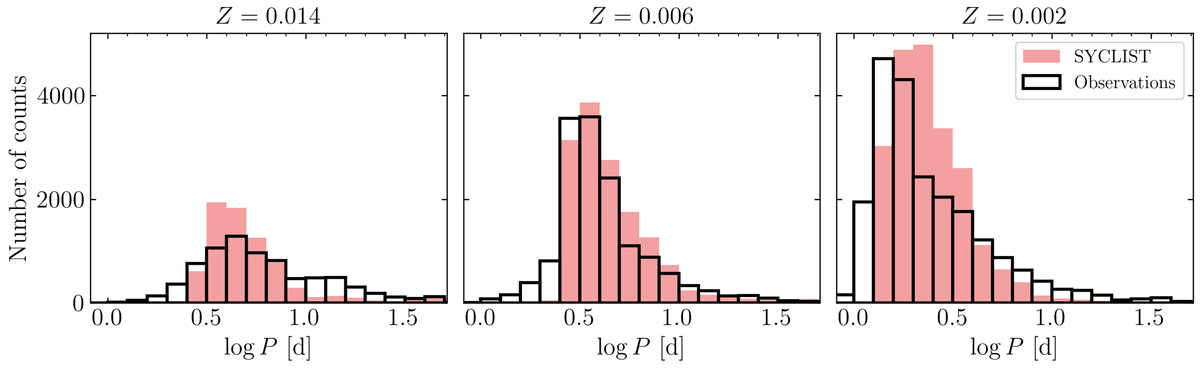
Distribution of log P for Z = 0.014 (left), 0.006 (middle), and 0.002 (right panel). The SYCLIST populations appear in red, while observations are shown as black histograms. Observations come from Pietrukowicz et al. (2021) and Soszyński et al. (2015, 2017) for Classical Cepheids in the Milky Way and Magellanic Clouds, respectively. Observational counts have been rescaled in order to match the numbers we have in SYCLIST simulations, by a factor 3.4, 5.9, and 7.5 for Z = 0.014, 0.006, and 0.002, respectively. The age limit applied (< 300 Myr) to the synthetic populations leads to mismatches at the shortest periods, particularly at Z = 0.002.
Current usage metrics show cumulative count of Article Views (full-text article views including HTML views, PDF and ePub downloads, according to the available data) and Abstracts Views on Vision4Press platform.
Data correspond to usage on the plateform after 2015. The current usage metrics is available 48-96 hours after online publication and is updated daily on week days.
Initial download of the metrics may take a while.