Fig. 5.
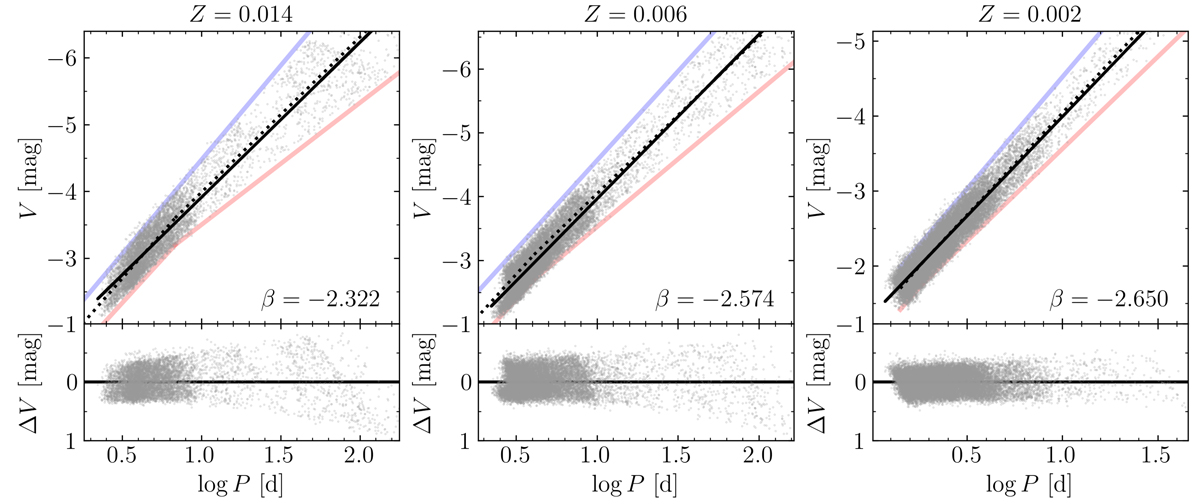
Download original image
Top: LLs in the V band, for Z = 0.014 (left), 0.006 (middle), and 0.002 (right panel). IS stars from SYCLIST are shown as grey points. The blue and red lines correspond to the IS boundaries from A16. The black solid line is the LL fit to the SYCLIST population, for log P0 = 0.0. The corresponding slope value, β, is annotated on the bottom right of each panel. The black dashed line shows the mid-IS fit, obtained by averaging the magnitude values for the blue and red boundaries at a given period. It shows a break in slope where the transition between the red edges for first crossing and second+third crossings occurs. Note: the varying axis ranges. Bottom: Residuals computed as the difference in magnitude between the individual SYCLIST stars and that of the SYCLIST LL fit at the same period.
Current usage metrics show cumulative count of Article Views (full-text article views including HTML views, PDF and ePub downloads, according to the available data) and Abstracts Views on Vision4Press platform.
Data correspond to usage on the plateform after 2015. The current usage metrics is available 48-96 hours after online publication and is updated daily on week days.
Initial download of the metrics may take a while.