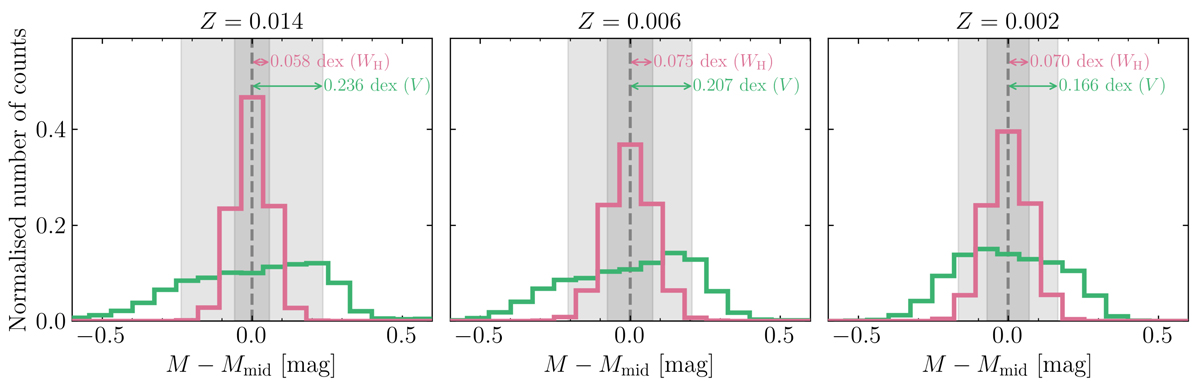
Fig. 7.
Download original image
LL scatter in the V-band (green) and WH magnitudes (pink), for Z = 0.014 (left), 0.006 (middle), and 0.002 (right panel). The histograms show the difference in magnitude between the individual SYCLIST IS stars and that of the SYCLIST LL fit at the same log P. The shaded regions correspond to the standard deviation, hence to the scatter of the LL and the values are reported on the plot with the corresponding colour.
Current usage metrics show cumulative count of Article Views (full-text article views including HTML views, PDF and ePub downloads, according to the available data) and Abstracts Views on Vision4Press platform.
Data correspond to usage on the plateform after 2015. The current usage metrics is available 48-96 hours after online publication and is updated daily on week days.
Initial download of the metrics may take a while.