Fig. 10
Download original image
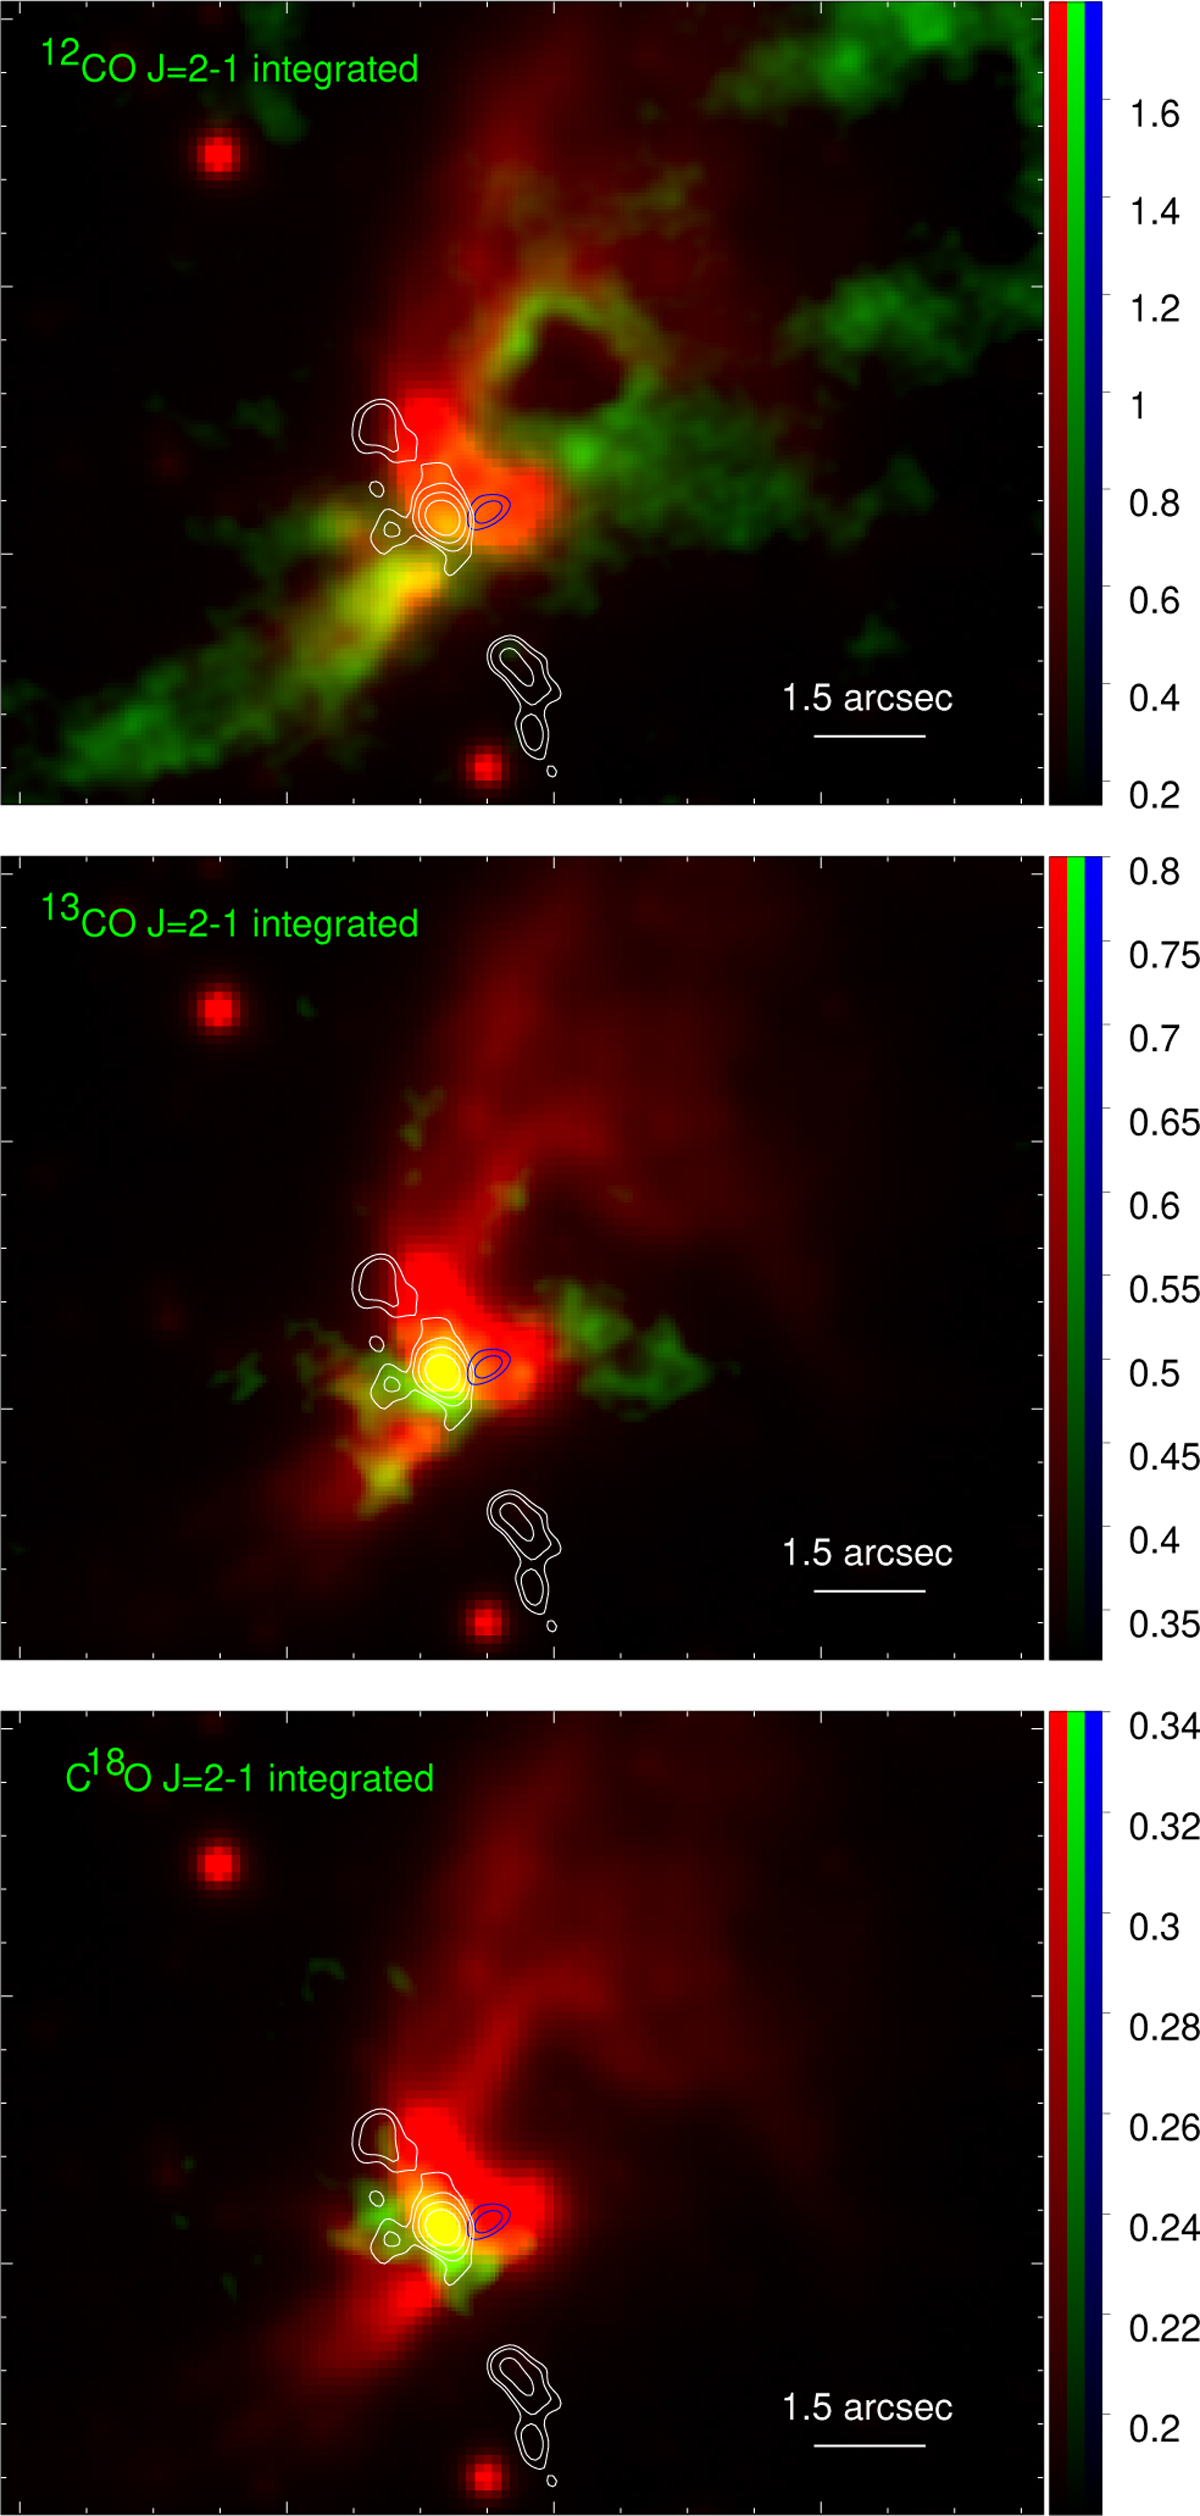
Two-colour maps of the YSO-G29 region. In green is displayed the 12CO, 13CO, and C18O J=2−1 emissions integrated along the whole frequency/velocity range in which each line extends as presented in Fig. 9. The Ks emission obtained with NIRI-Gemini is shown in red. White contours represent the continuum emission at 1.3 mm (same levels as Fig. 8), and blue contours are the continuum emission at 10 GHz (same levels as Fig. 8). The units of the colour bars at the right of each image are Jy beam−1 km s−1 and correspond to the green colour of the maps. The rms noise level of the molecular integrated emission is about 0.15 Jy beam−1 km s−1 for the three maps.
Current usage metrics show cumulative count of Article Views (full-text article views including HTML views, PDF and ePub downloads, according to the available data) and Abstracts Views on Vision4Press platform.
Data correspond to usage on the plateform after 2015. The current usage metrics is available 48-96 hours after online publication and is updated daily on week days.
Initial download of the metrics may take a while.