Fig. D.2
Download original image
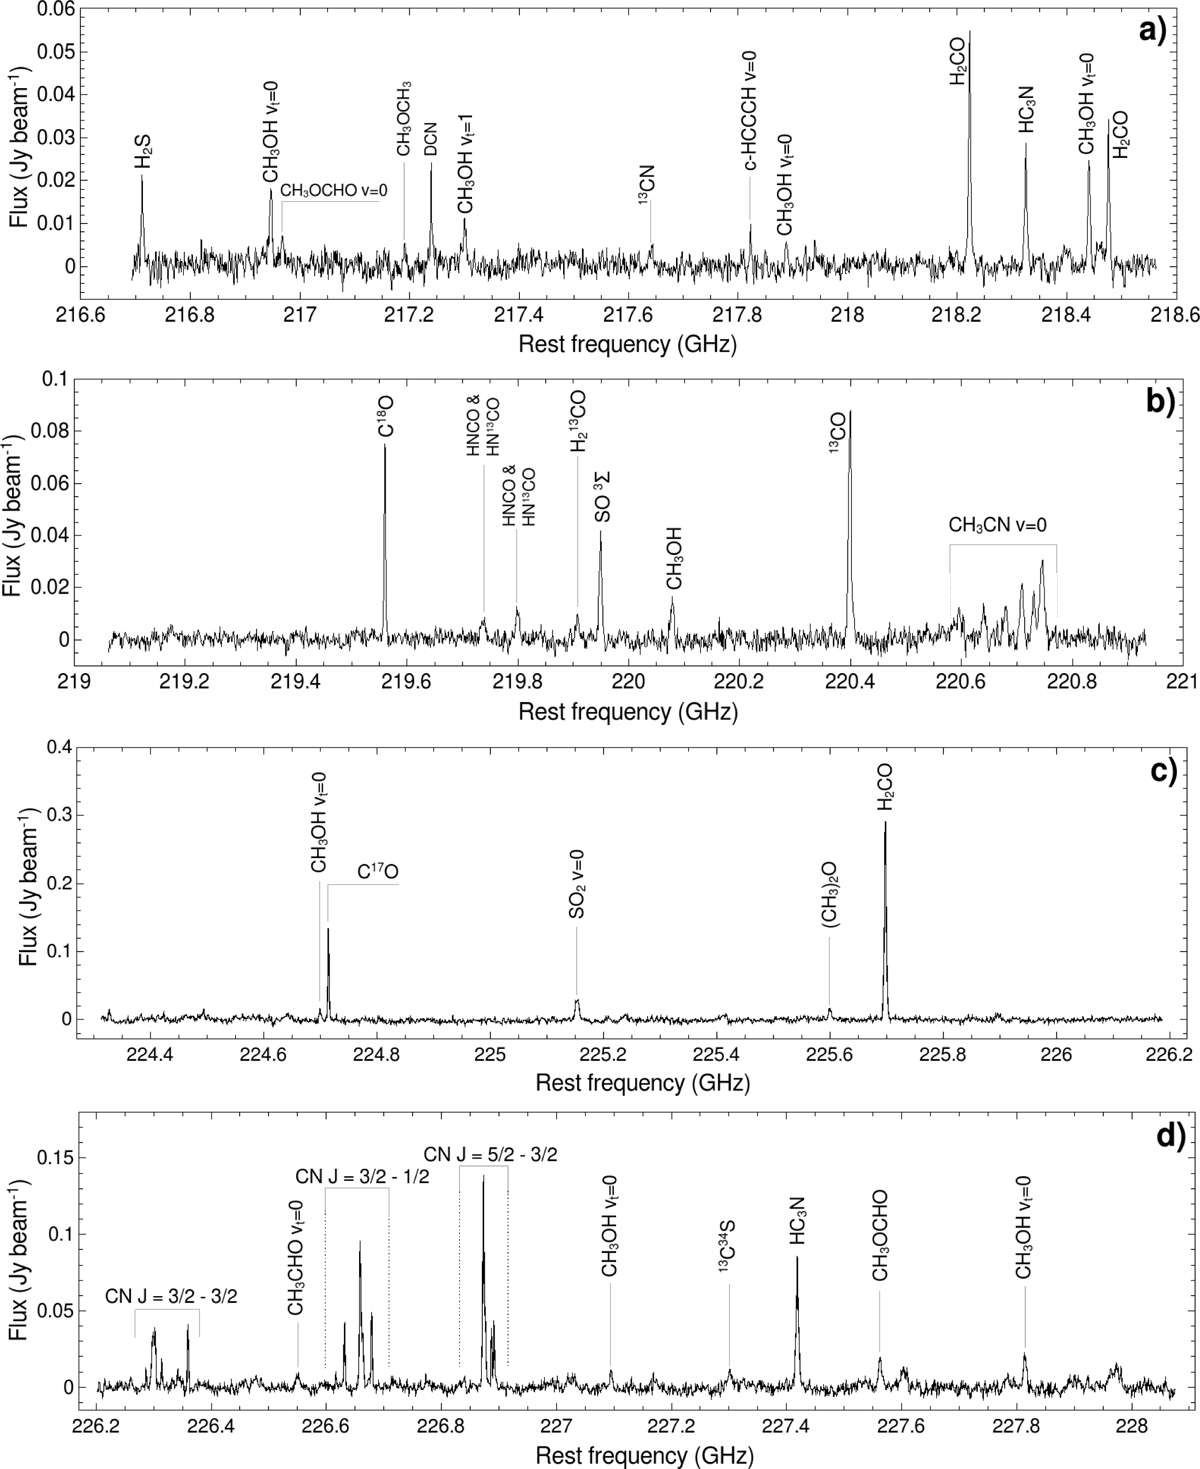
Spectra of the eight spectral windows analysed in this study. Panels a), b), e), and f) present data obtained from the observations reported by Liu et al. (Project 2021.1.00311.S), whereas panels c), d), g), and h) correspond to the dataset acquired by Fuller et al. (Project 2015.1.01312.S). Each spectrum was extracted from a beam-size region centred at the peak of the continuum emission. Molecular transitions were identified using the SDAS database.
Current usage metrics show cumulative count of Article Views (full-text article views including HTML views, PDF and ePub downloads, according to the available data) and Abstracts Views on Vision4Press platform.
Data correspond to usage on the plateform after 2015. The current usage metrics is available 48-96 hours after online publication and is updated daily on week days.
Initial download of the metrics may take a while.