Fig. 8
Download original image
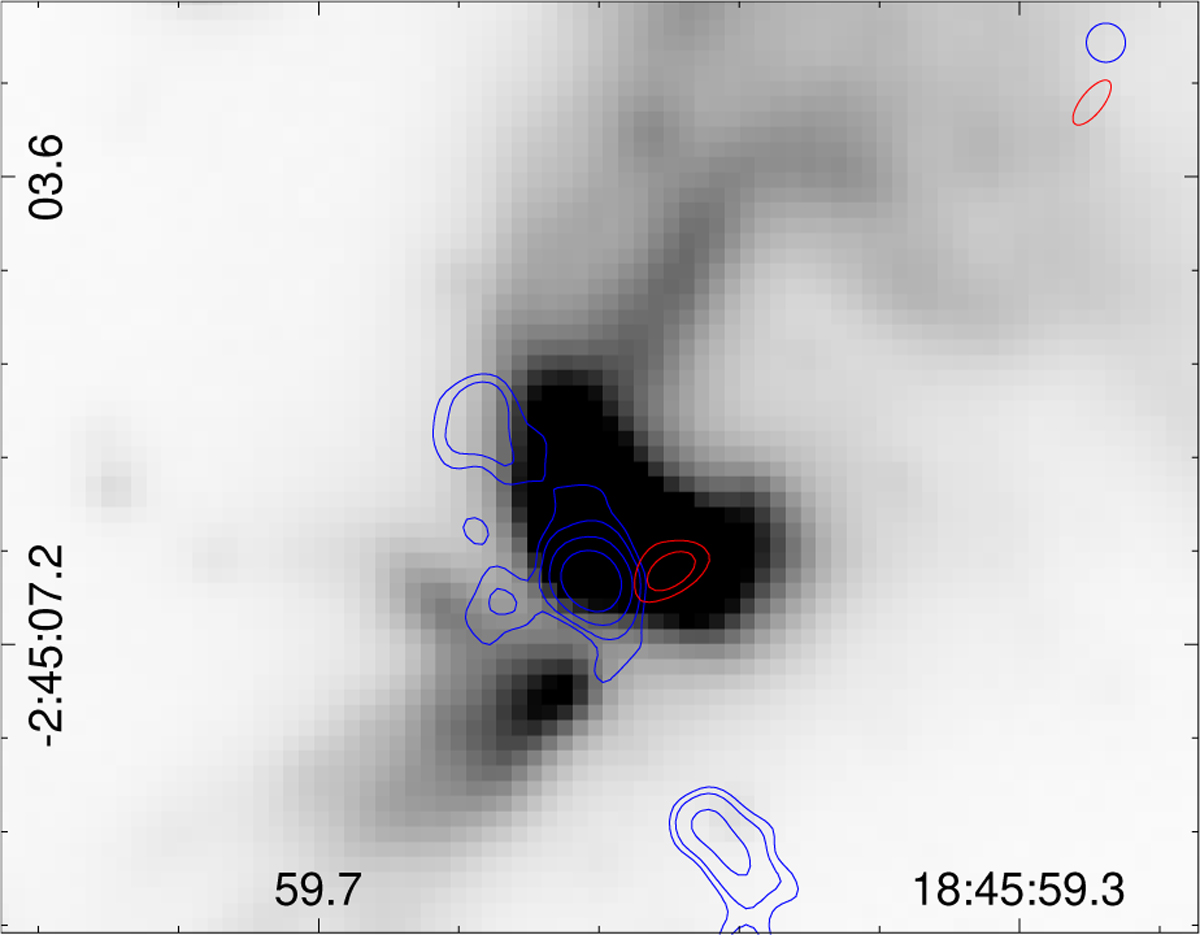
Ks image presented in our previous work obtained with NIRI at Gemini North (Areal et al. 2020). Blue contours represent the continuum emission at 1.3 mm obtained with ALMA at levels 1.8, 2.4, 4.0, and 8.0 mJy beam−1 (rms = 0.2 mJy beam−1). Radio continuum emission at 10 GHz acquired with JVLA is presented in red contours with levels of 20 and 50 µJy beam−1 (rms = 6 µJy beam−1). The beams of the ALMA and JVLA observations (blue and red) are presented at the top-right corner.
Current usage metrics show cumulative count of Article Views (full-text article views including HTML views, PDF and ePub downloads, according to the available data) and Abstracts Views on Vision4Press platform.
Data correspond to usage on the plateform after 2015. The current usage metrics is available 48-96 hours after online publication and is updated daily on week days.
Initial download of the metrics may take a while.