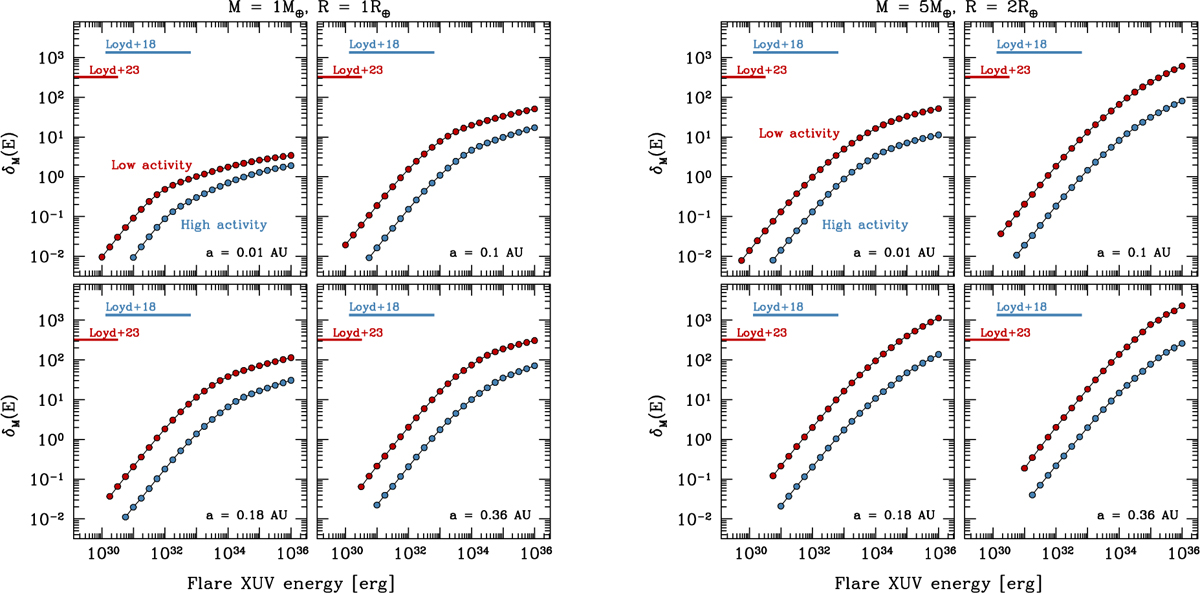
Fig. 2
Download original image
Fractional mass-loss increase per flare (as given by Eq. (5)) as a function of flare energy for both the low-activity (red) and high-activity (blue) cases, each evaluated at four different orbital distances; the 0.18-0.36 AU range brackets the extent of the HZ for the chosen host star. The horizontal lines at the top denote the energy range over which the FFDs were observationally constrained (Loyd et al. 2018, 2023). Our simulations extend to include flare energies up to 1036 erg. The left and right panels refer to the Earth- and sub-Neptune-sized planet, respectively.
Current usage metrics show cumulative count of Article Views (full-text article views including HTML views, PDF and ePub downloads, according to the available data) and Abstracts Views on Vision4Press platform.
Data correspond to usage on the plateform after 2015. The current usage metrics is available 48-96 hours after online publication and is updated daily on week days.
Initial download of the metrics may take a while.