Open Access
Fig. 3
Download original image
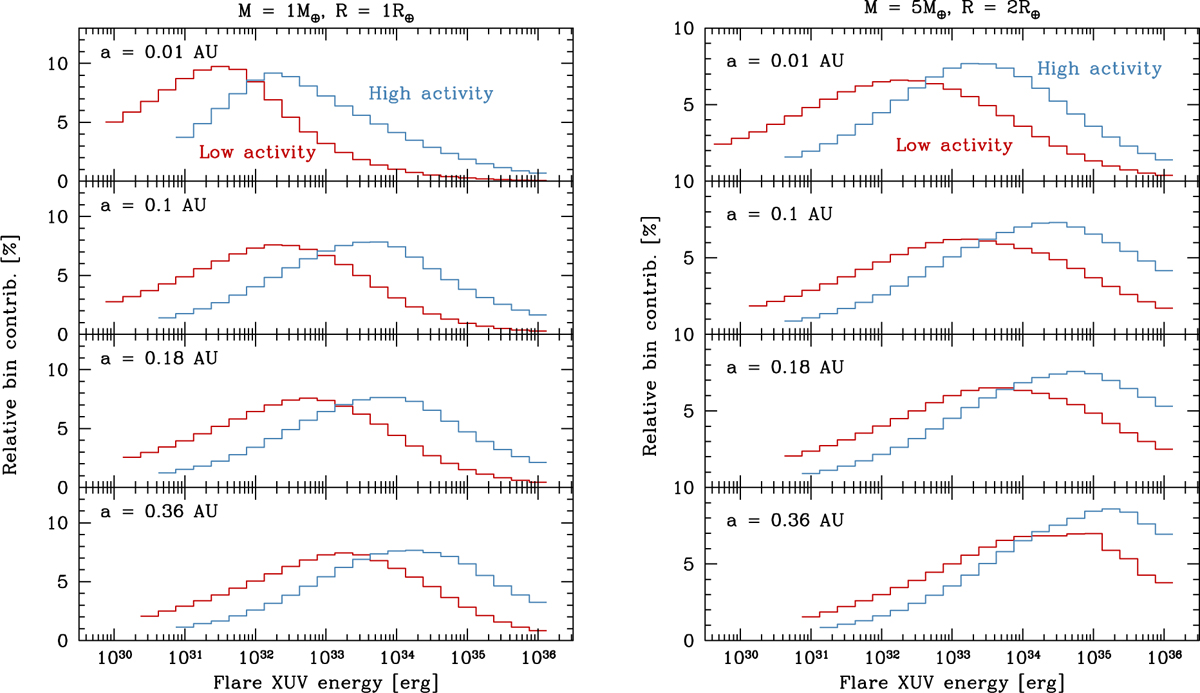
Fractional contributions to the flare-driven mass-loss increase (Eq. (4)) from different flare energies, shown for the high-activity (blue histogram) and low-activity (red) phase, and for four orbital separations. The left and right panels correspond to the Earth-sized planet and the sub-Neptune-sized planet, respectively.
Current usage metrics show cumulative count of Article Views (full-text article views including HTML views, PDF and ePub downloads, according to the available data) and Abstracts Views on Vision4Press platform.
Data correspond to usage on the plateform after 2015. The current usage metrics is available 48-96 hours after online publication and is updated daily on week days.
Initial download of the metrics may take a while.