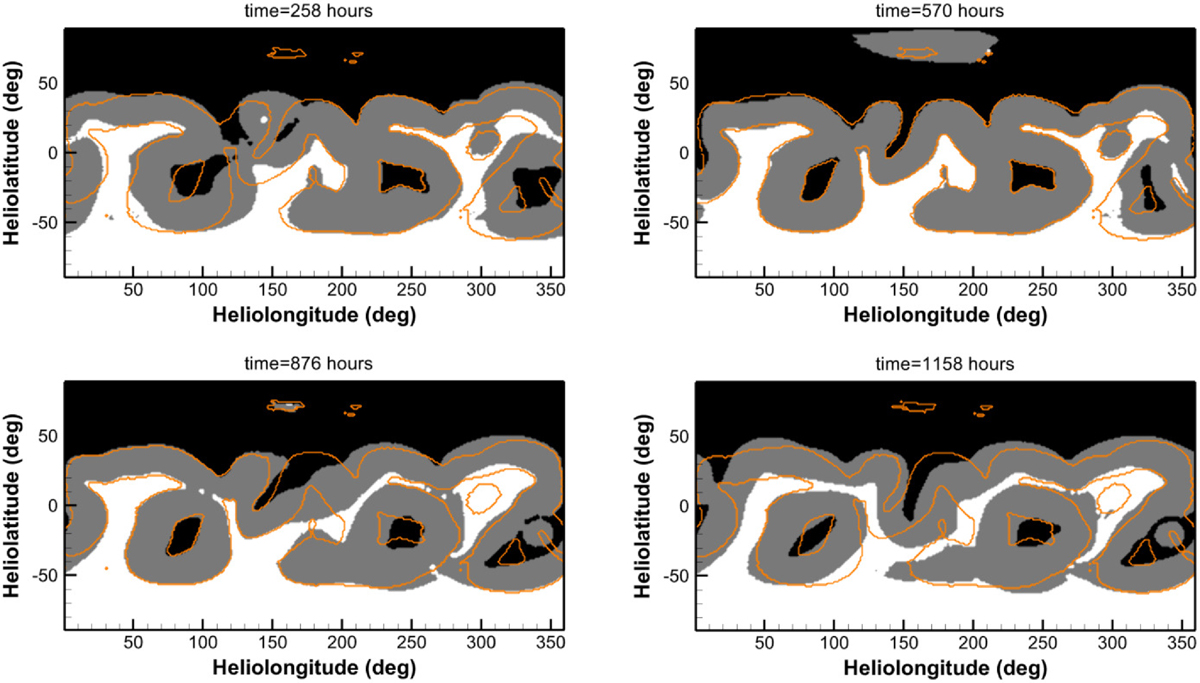
Fig. 2.
Download original image
Distributions of open- and closed-field regions derived from the time-evolving (contours) and quasi-steady-state (orange lines) simulation results. All shown in a co-rotating coordinate system, and the white and black patches represent open-field regions with magnetic field lines pointing outward and inward relative to the Sun, respectively. The grey patches indicate closed-field regions. The solid orange lines overlaid on these contours denote the edge of close-field regions derived from the quasi-steady-state simulation results.
Current usage metrics show cumulative count of Article Views (full-text article views including HTML views, PDF and ePub downloads, according to the available data) and Abstracts Views on Vision4Press platform.
Data correspond to usage on the plateform after 2015. The current usage metrics is available 48-96 hours after online publication and is updated daily on week days.
Initial download of the metrics may take a while.