Open Access
Fig. 4.
Download original image
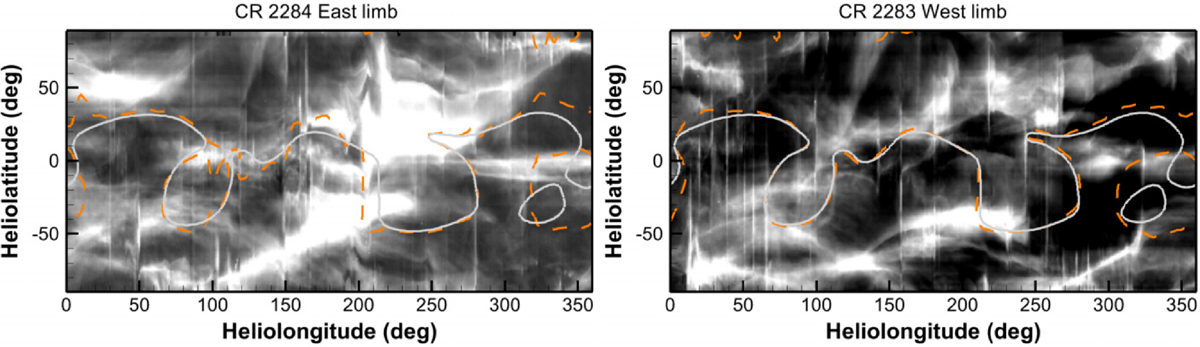
Synoptic maps of east (left) and west limb (right) white-light pB observations from the SOHO instrument LASCO C2 at 3 Rs for CRs 2284 and 2283, respectively. The dashed orange line and solid grey line represent the corresponding MNLs derived from the time-evolving and quasi-steady-state simulations, respectively.
Current usage metrics show cumulative count of Article Views (full-text article views including HTML views, PDF and ePub downloads, according to the available data) and Abstracts Views on Vision4Press platform.
Data correspond to usage on the plateform after 2015. The current usage metrics is available 48-96 hours after online publication and is updated daily on week days.
Initial download of the metrics may take a while.