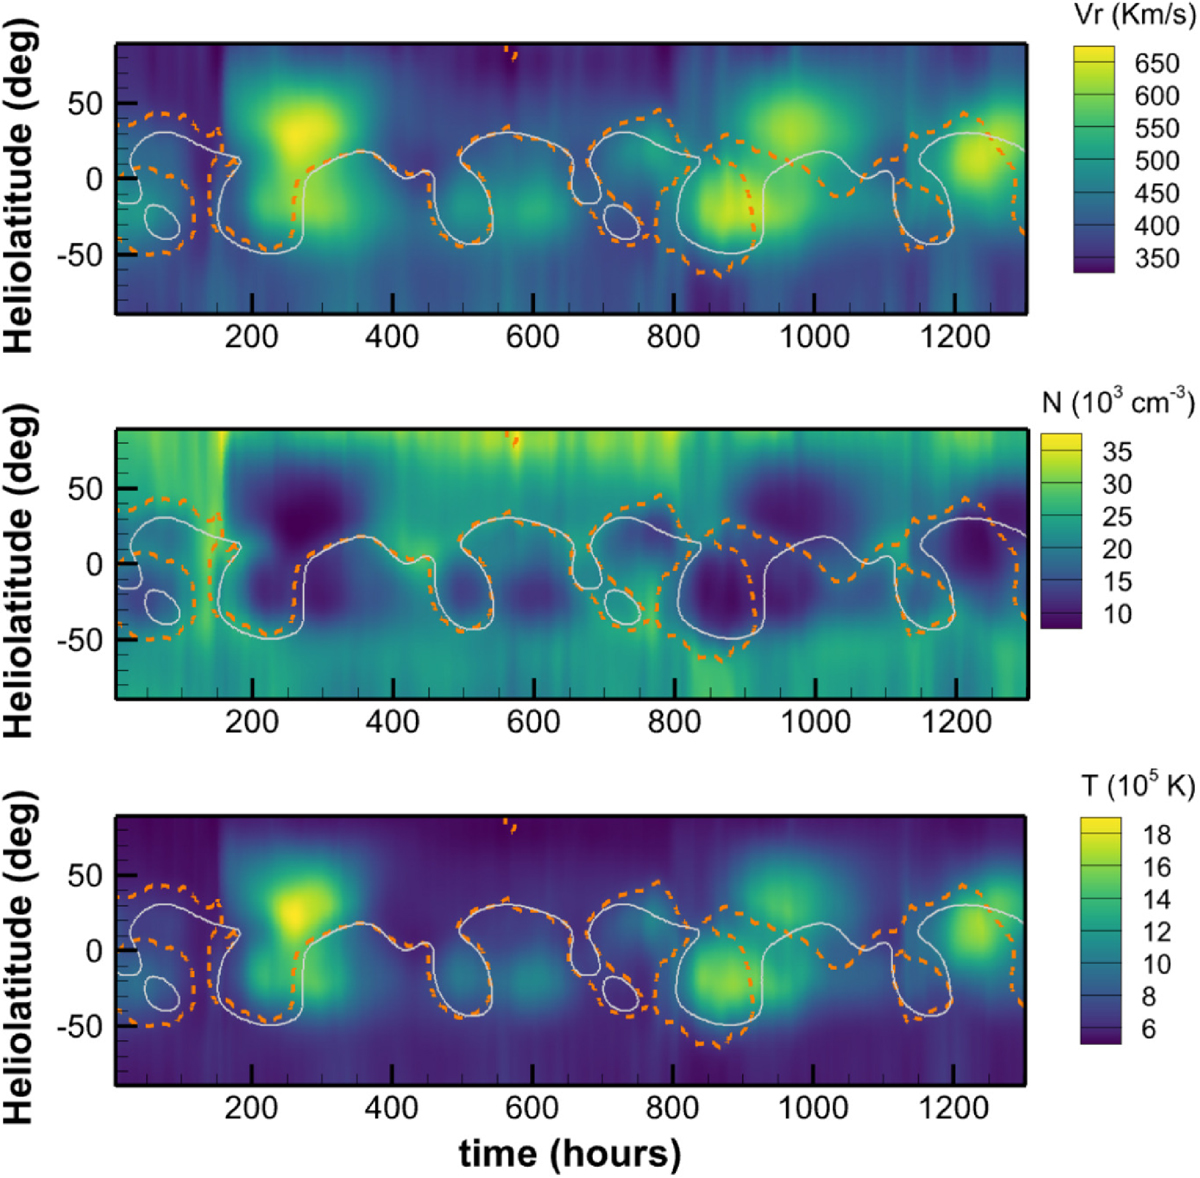
Fig. 5.
Download original image
Timing diagrams of simulated radial velocity Vr (km s−1, top), plasma number density (103 cm−3, middle), and temperature (105 K, bottom) along the latitudes intersected by the Sun–Earth line at 0.1 AU. The dashed orange and solid grey lines represent the MNLs derived from the time-evolving and quasi-steady-state simulations, respectively.
Current usage metrics show cumulative count of Article Views (full-text article views including HTML views, PDF and ePub downloads, according to the available data) and Abstracts Views on Vision4Press platform.
Data correspond to usage on the plateform after 2015. The current usage metrics is available 48-96 hours after online publication and is updated daily on week days.
Initial download of the metrics may take a while.