Fig. 7.
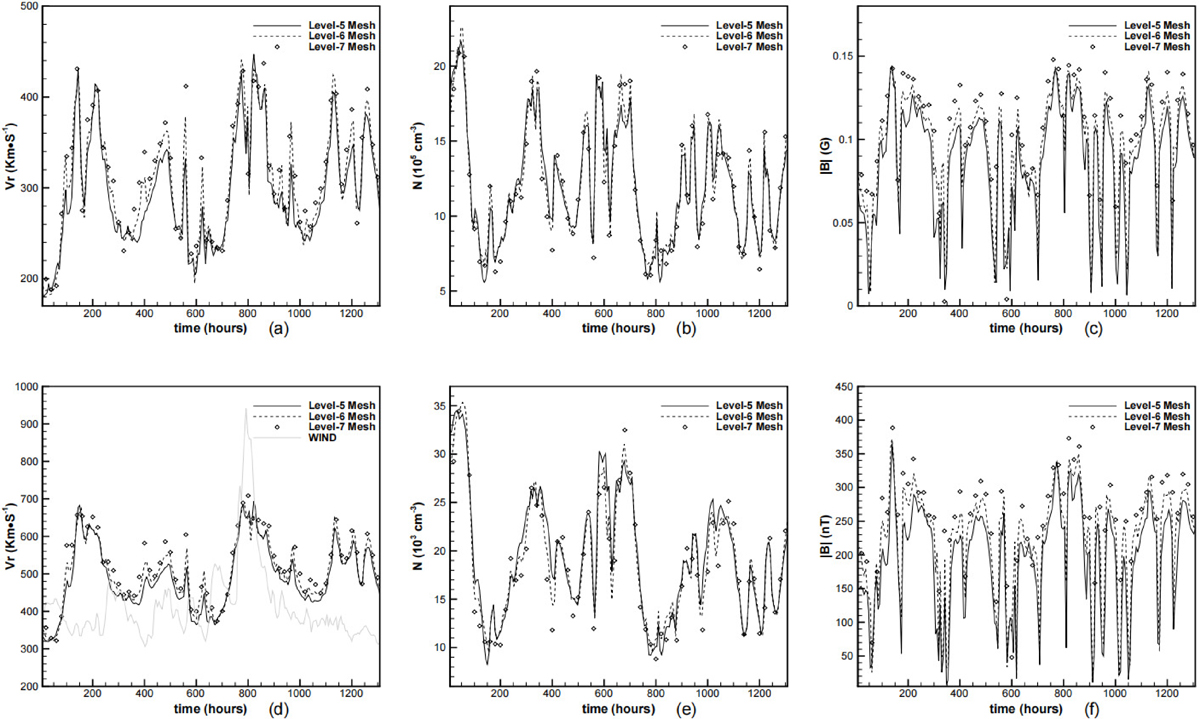
Download original image
Timing diagram of the radial velocity Vr (km s−1; a, d), proton number density (105 cm−3 at 3 Rs and 103 cm−3 at 21.5 Rs; b, e), and magnetic field strength |B| (G; c, f) observed by two virtual satellites located at 3 Rs (a, b, c) and 21.5 Rs (d, e, f), respectively. These virtual satellites are positioned at the same latitude as Earth, but lag by 60° in longitude. The solid and dashed black lines and diamonds represent the time-evolving simulation results on the fifth-, sixth-, and seventh-level subdivided geodesic meshes, respectively, and the solid grey line indicates the radial velocity observed by the WIND satellite.
Current usage metrics show cumulative count of Article Views (full-text article views including HTML views, PDF and ePub downloads, according to the available data) and Abstracts Views on Vision4Press platform.
Data correspond to usage on the plateform after 2015. The current usage metrics is available 48-96 hours after online publication and is updated daily on week days.
Initial download of the metrics may take a while.