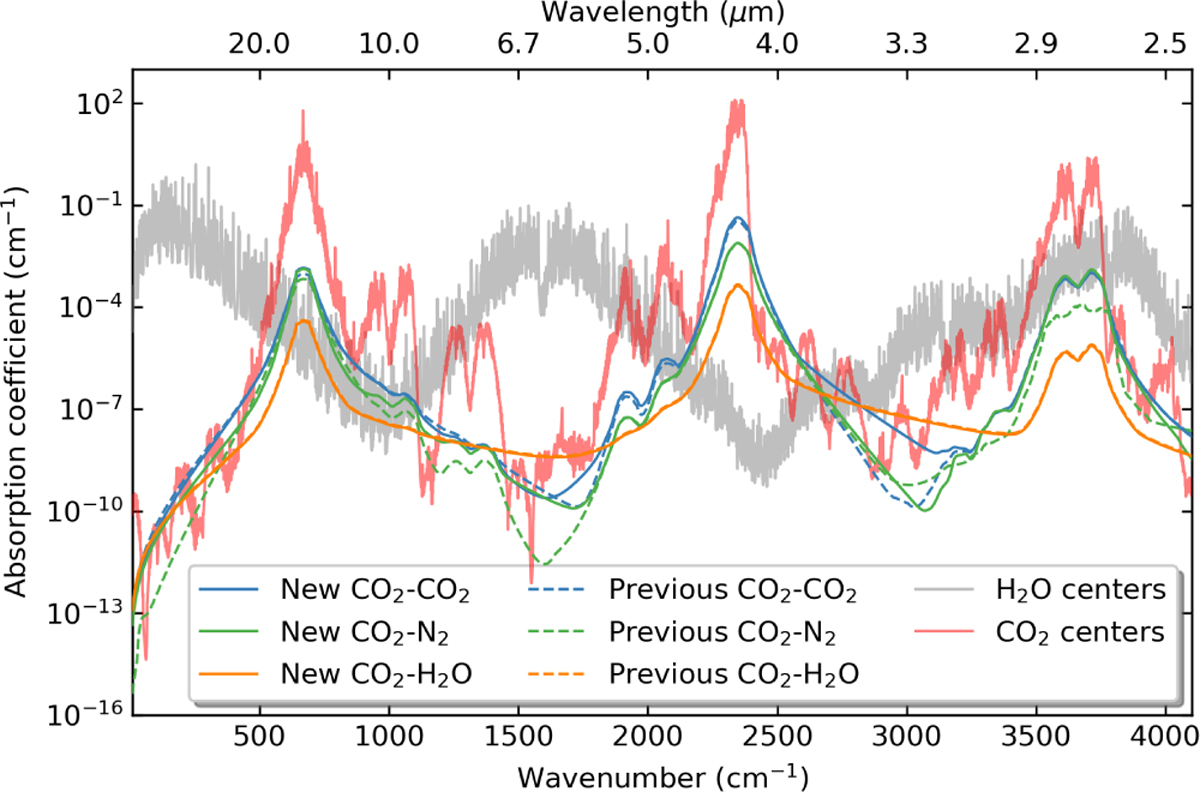
Fig. 2
Download original image
Absorption spectrum for a gas mixture including 0.01 bar of H2O, 1 bar of CO2, and 1 bar of N2 at 300 K. The red and gray lines are the spectra containing the centers of absorption lines (of CO2 and H2O, respectively) up to ±25 cm−1. The other solid lines are the CO2 continua obtained using the original χ factors from this work, while the dashed lines are the spectra calculated with previously existing factors. The continua calculated with existing χ factors (dashed lines) are based on Tran et al. (2011), Perrin & Hartmann (1989), and Tran et al. (2018) for pure CO2, CO2-N2, and CO2-H2O, respectively. For this comparison, we did not use χ factors from Burch et al. (1969) to calculate the ν1 + ν3 band of CO2-N2 as it is based on a different formalism, and thus the factors derived for the ν3 band (Perrin & Hartmann 1989) are applied everywhere (green dashed line).
Current usage metrics show cumulative count of Article Views (full-text article views including HTML views, PDF and ePub downloads, according to the available data) and Abstracts Views on Vision4Press platform.
Data correspond to usage on the plateform after 2015. The current usage metrics is available 48-96 hours after online publication and is updated daily on week days.
Initial download of the metrics may take a while.