Fig. B.3
Download original image
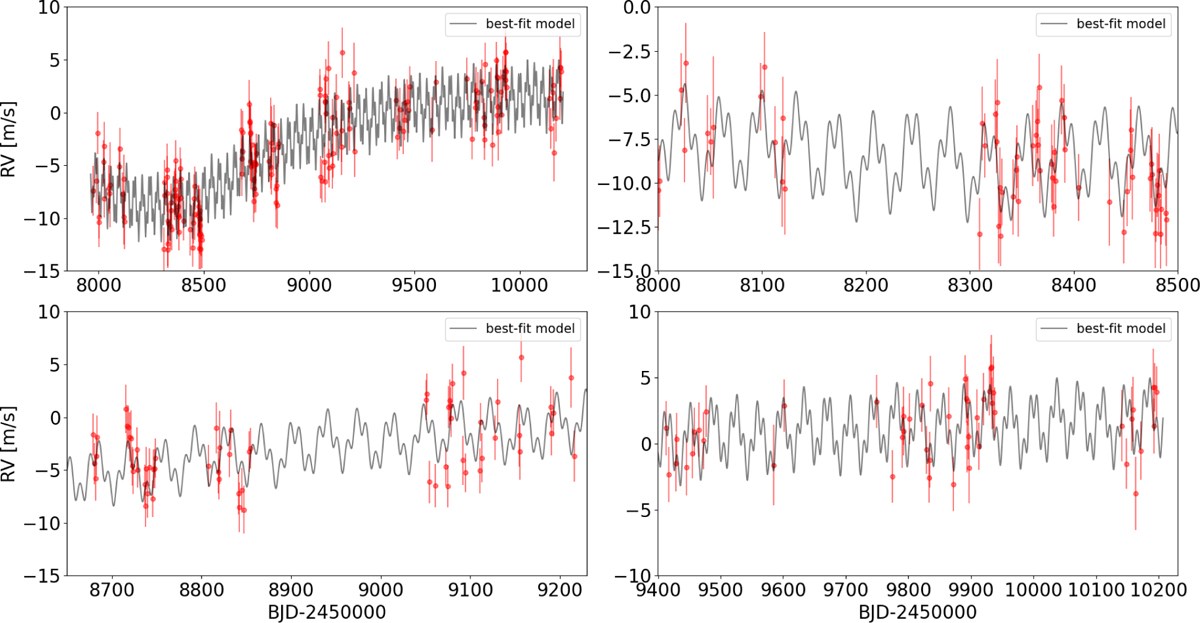
Time series of the RVs. The measurements are indicated by red dots, and our best-fit spectroscopic model is over-plotted with a black line. The upper left panel shows the full time series, the other plots show zoomed-in views to better appreciate the agreement between the observations and best-fit model. The error bars include the uncorrelated jitter added in quadrature to the RV uncertainties.
Current usage metrics show cumulative count of Article Views (full-text article views including HTML views, PDF and ePub downloads, according to the available data) and Abstracts Views on Vision4Press platform.
Data correspond to usage on the plateform after 2015. The current usage metrics is available 48-96 hours after online publication and is updated daily on week days.
Initial download of the metrics may take a while.