Fig. B.4
Download original image
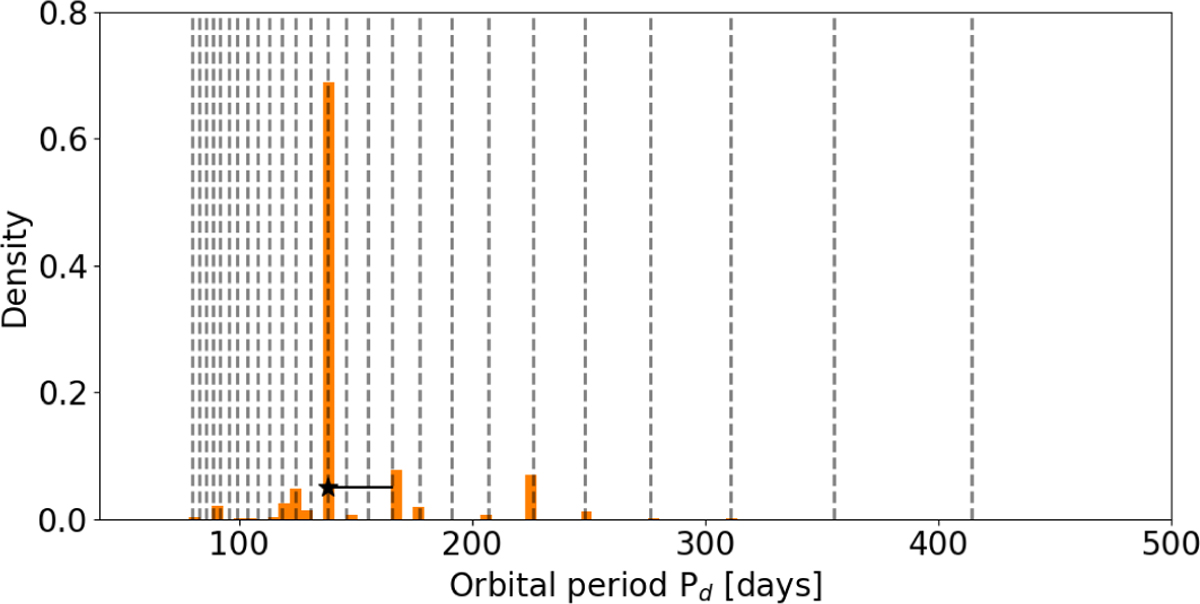
Posterior of the orbital period Pd obtained from a joint RV and photometry modelling. The width of each bin is ~5 days. The best-fit value (±1σ) is indicated with a black asterisk. Dashed vertical lines correspond to possible orbital periods from a grid of discrete Pd values calculated from the transit midpoints from K2 and TESS.
Current usage metrics show cumulative count of Article Views (full-text article views including HTML views, PDF and ePub downloads, according to the available data) and Abstracts Views on Vision4Press platform.
Data correspond to usage on the plateform after 2015. The current usage metrics is available 48-96 hours after online publication and is updated daily on week days.
Initial download of the metrics may take a while.