Open Access
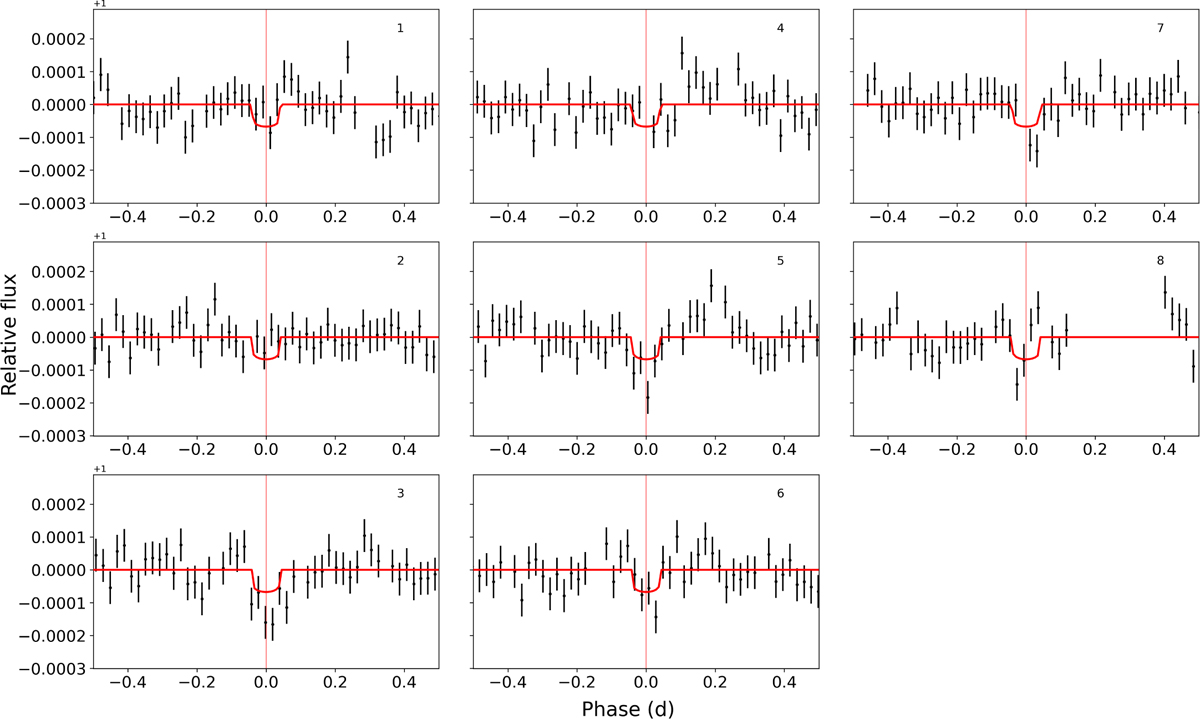
Fig. B.6
Download original image
Individual transits of HD 224018 b in the K2 light curve, following the order specified in the top right label of each panel. The best-model fit is represented by the red line. Note that the light curve has been cleared of both the systematics and the transits of the other two planets.
Current usage metrics show cumulative count of Article Views (full-text article views including HTML views, PDF and ePub downloads, according to the available data) and Abstracts Views on Vision4Press platform.
Data correspond to usage on the plateform after 2015. The current usage metrics is available 48-96 hours after online publication and is updated daily on week days.
Initial download of the metrics may take a while.