Fig. 3

Download original image
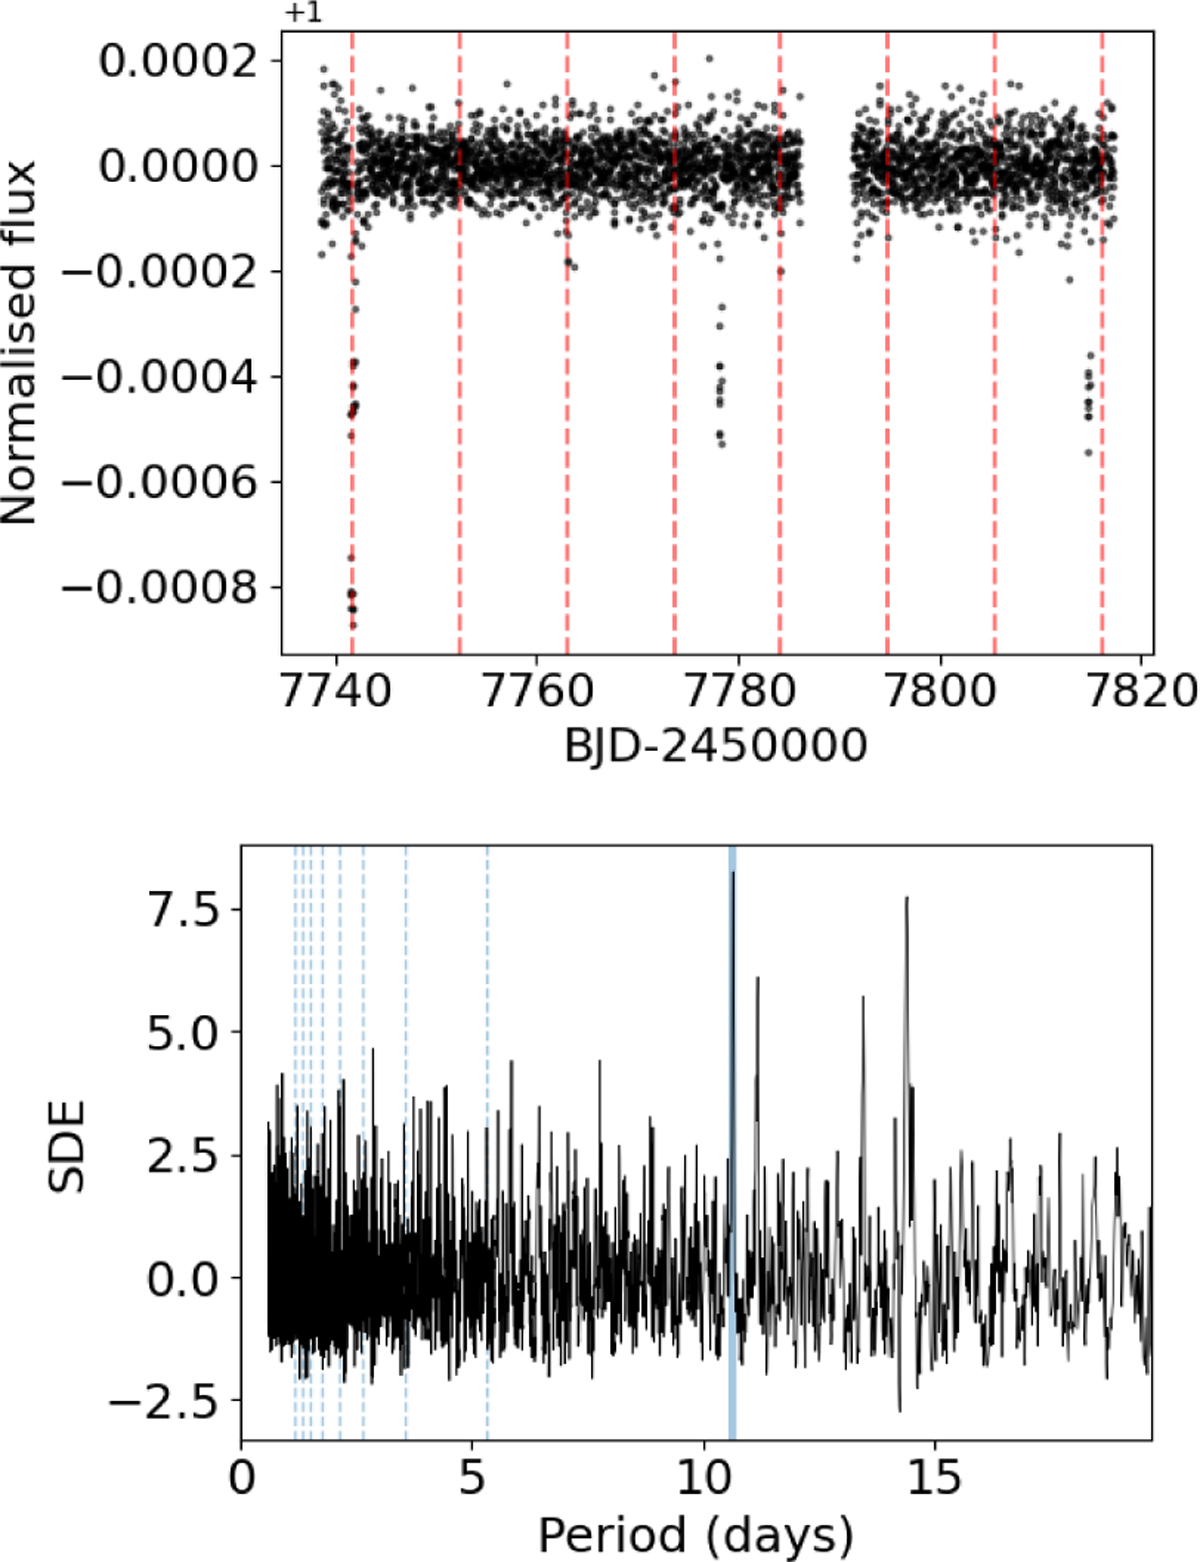
Results from the detrending of the K2 light curve with wotan. Upper panel : detrended light curve, with the epochs of the transits of HD 224018 b indicated by vertical dashed lines. Lower panel : TLS periodogram after masking the 36.6 day transits and the mono-transit, and restricting the search to orbital periods shorter than 19.7 days. The main peak is found at 10.64 days. Individual transits with very low S/N transits are shown in Fig. B.6, demonstrating how a fine-tuned detrending was crucial for their detection.
Current usage metrics show cumulative count of Article Views (full-text article views including HTML views, PDF and ePub downloads, according to the available data) and Abstracts Views on Vision4Press platform.
Data correspond to usage on the plateform after 2015. The current usage metrics is available 48-96 hours after online publication and is updated daily on week days.
Initial download of the metrics may take a while.


