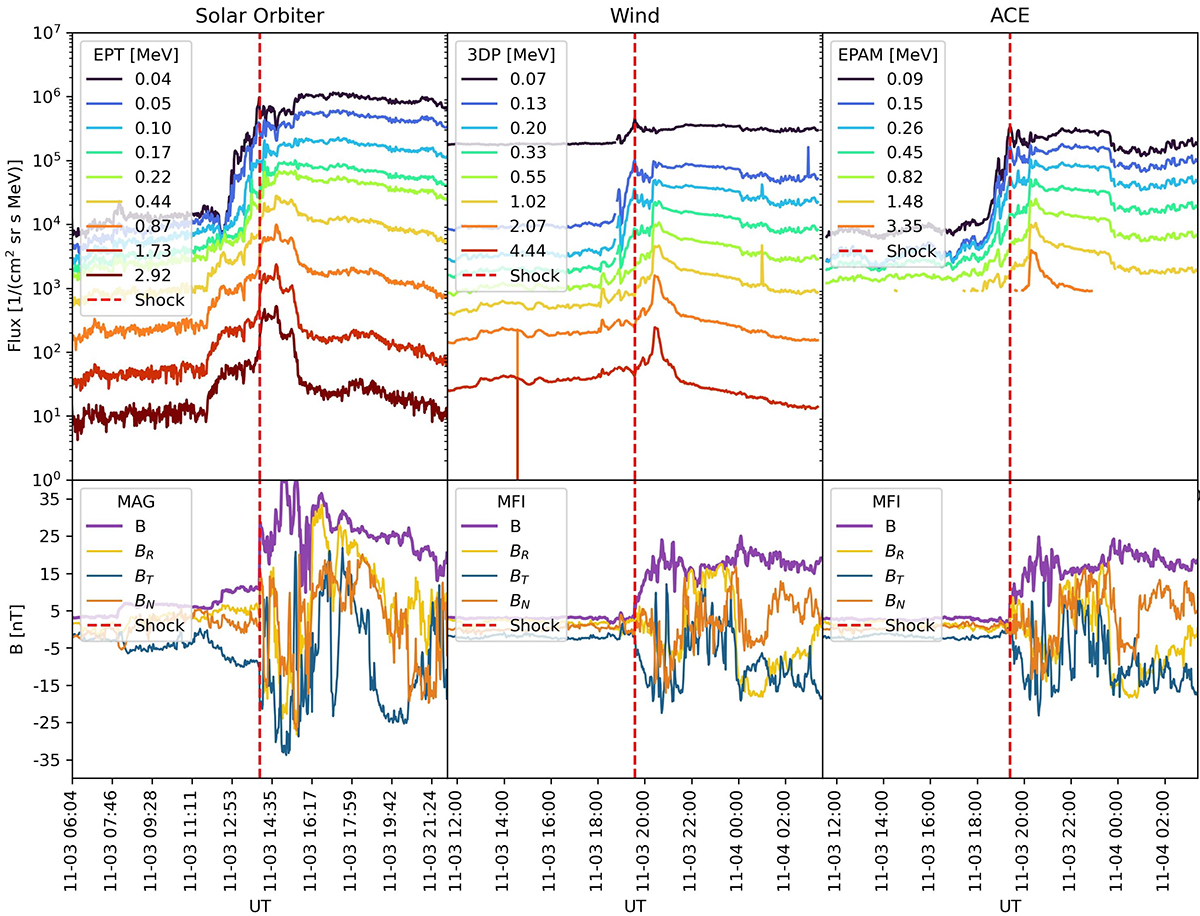
Fig. 2.
Download original image
Sixteen-hour overview of energetic particle fluxes (top) and magnetic field (bottom) observations by Solar Orbiter, Wind, and ACE (from left to right). The dashed vertical line identifies the shock transition, and it is at the center of the overview for each plot. We show 9 of the 64 energy channels available from Solar Orbiter EPT.
Current usage metrics show cumulative count of Article Views (full-text article views including HTML views, PDF and ePub downloads, according to the available data) and Abstracts Views on Vision4Press platform.
Data correspond to usage on the plateform after 2015. The current usage metrics is available 48-96 hours after online publication and is updated daily on week days.
Initial download of the metrics may take a while.