Open Access
Fig. 3.
Download original image
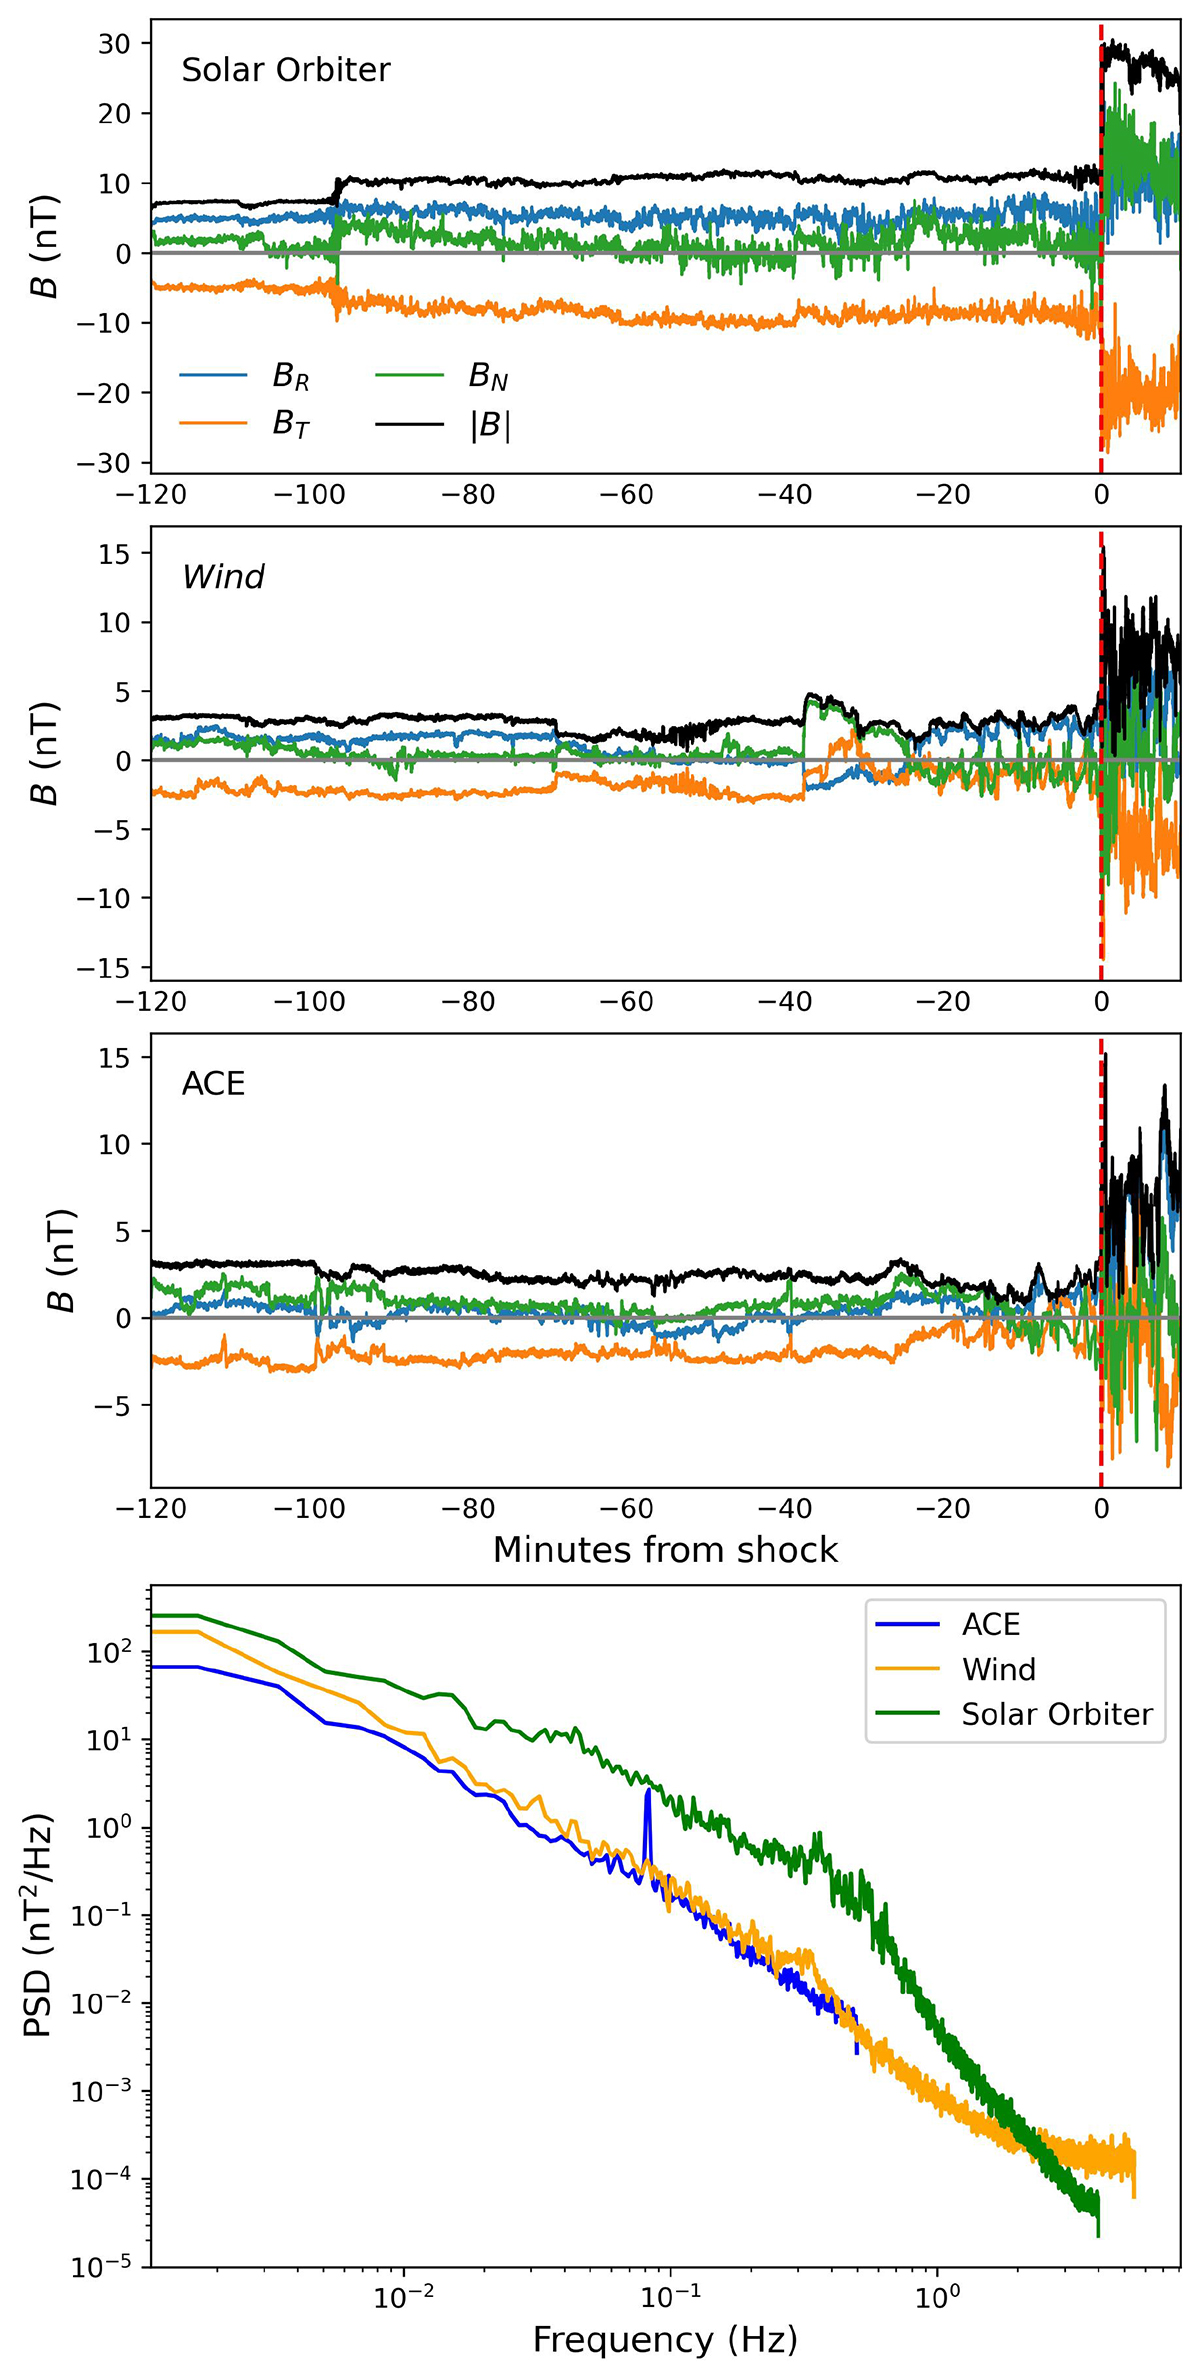
Magnetic field magnitude and components for 2 hours upstream of the shock at Solar Orbiter, Wind, and ACE (top to bottom, respectively). The dashed red line marks the shock transition. In the bottom panel, we show the trace magnetic field power spectral densities for 2 hours upstream of each event.
Current usage metrics show cumulative count of Article Views (full-text article views including HTML views, PDF and ePub downloads, according to the available data) and Abstracts Views on Vision4Press platform.
Data correspond to usage on the plateform after 2015. The current usage metrics is available 48-96 hours after online publication and is updated daily on week days.
Initial download of the metrics may take a while.