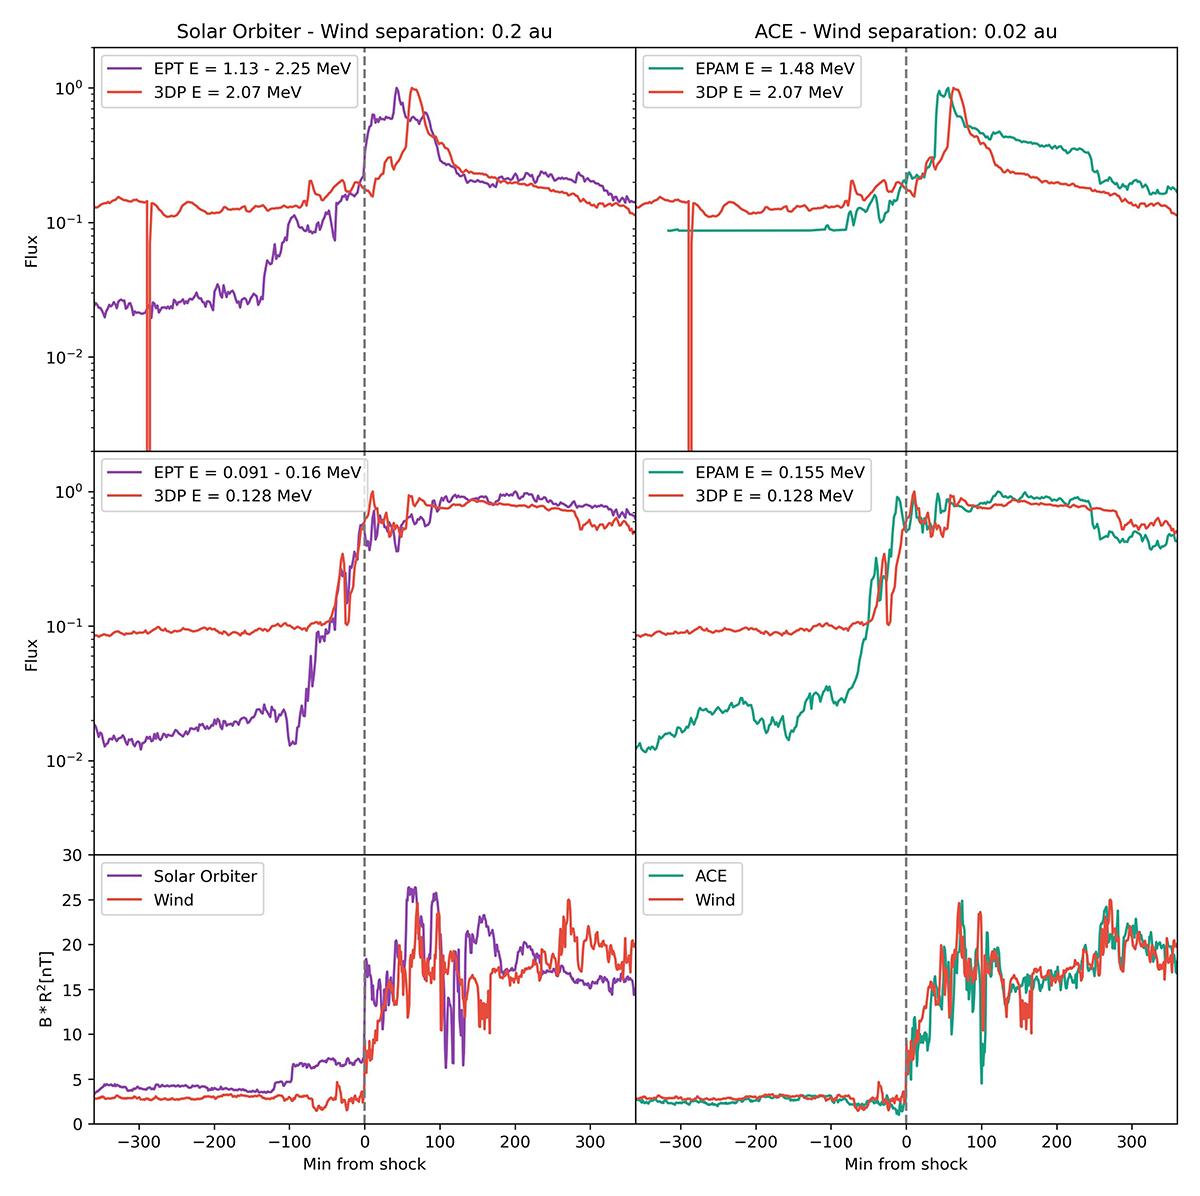
Fig. 4.
Download original image
Twelve-hour overview of the event, where magnetic fields and intensity-time energetic particle profiles are overlaid for the Solar Orbiter-Wind (left) and for the ACE-Wind observations. The fluxes are normalized to the maximum flux in each interval. From top to bottom, we show an example of high (top) and low (middle) energy particle intensity-time profiles and the magnetic field magnitude, scaled with the square of the heliocentric distance.
Current usage metrics show cumulative count of Article Views (full-text article views including HTML views, PDF and ePub downloads, according to the available data) and Abstracts Views on Vision4Press platform.
Data correspond to usage on the plateform after 2015. The current usage metrics is available 48-96 hours after online publication and is updated daily on week days.
Initial download of the metrics may take a while.