Fig. 5.
Download original image
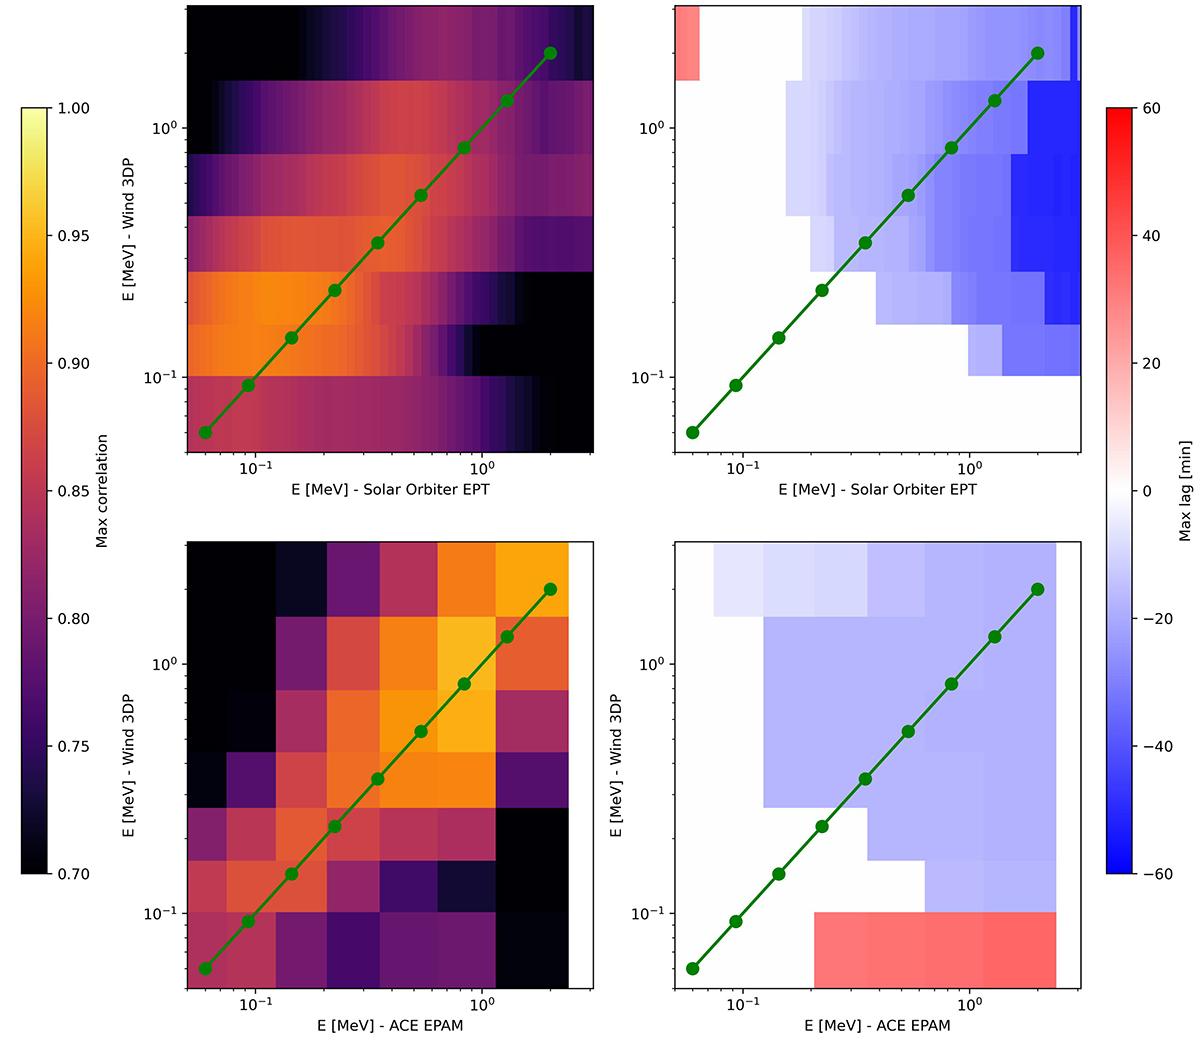
Left: Magic squares showing the peak correlation for particle intensity-time profiles in all available energy bins (left) for Solar Orbiter-Wind (top) and ACE-Wind (bottom). Right: Magic squares displaying the lag at which the peak correlation displayed in the left panels are achieved. The green dots show selected logarithmically spaced energies at which the peak correlation and lags are interpolated in Figure 6 below.
Current usage metrics show cumulative count of Article Views (full-text article views including HTML views, PDF and ePub downloads, according to the available data) and Abstracts Views on Vision4Press platform.
Data correspond to usage on the plateform after 2015. The current usage metrics is available 48-96 hours after online publication and is updated daily on week days.
Initial download of the metrics may take a while.