Fig. A.1.
Download original image
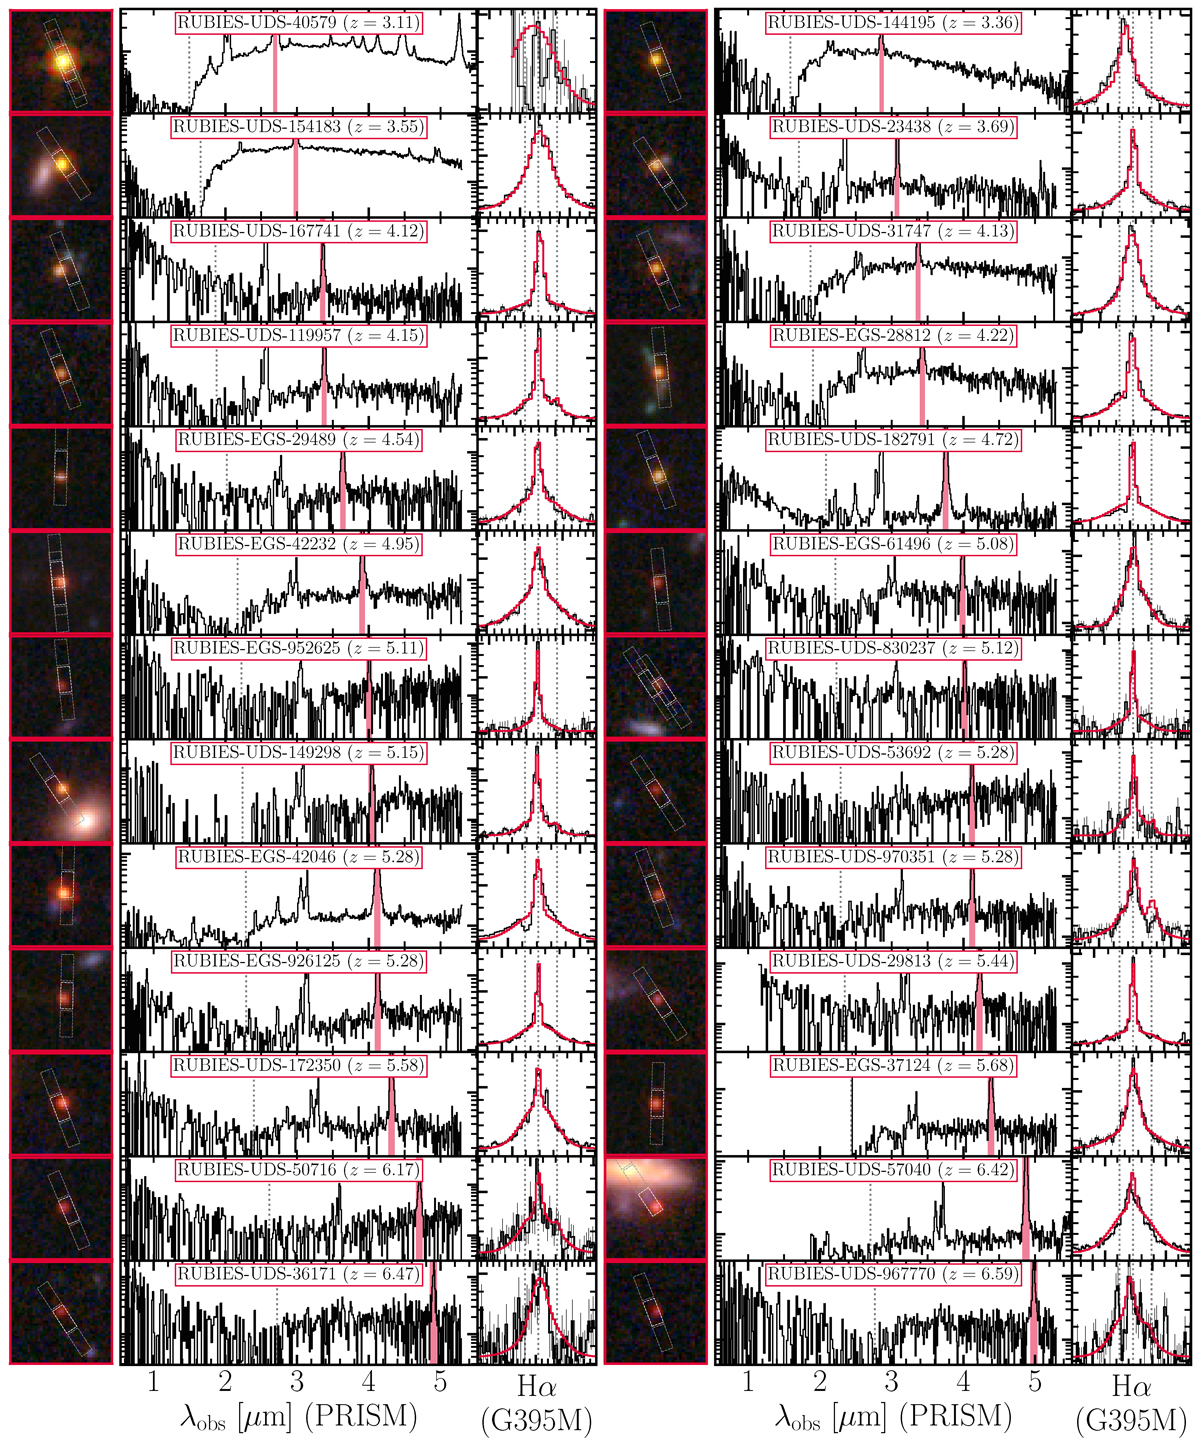
All RUBIES LRDs (red) found in this work followed by rest-optical point sources with v-shaped continua (orange) all organized by redshift. In each column in each row we show the following: the 1″ × 1″ F444W/F277W/F150W RGB cutouts (left), the log-scaled PRISM spectra with the location of the Balmer limit marked with a dashed line (middle), and the linear-scaled G395M ±3000 km s−1 zoom-in of the Hα line where available, otherwise Hβ, with the broad unite fit superimposed (right).
Current usage metrics show cumulative count of Article Views (full-text article views including HTML views, PDF and ePub downloads, according to the available data) and Abstracts Views on Vision4Press platform.
Data correspond to usage on the plateform after 2015. The current usage metrics is available 48-96 hours after online publication and is updated daily on week days.
Initial download of the metrics may take a while.