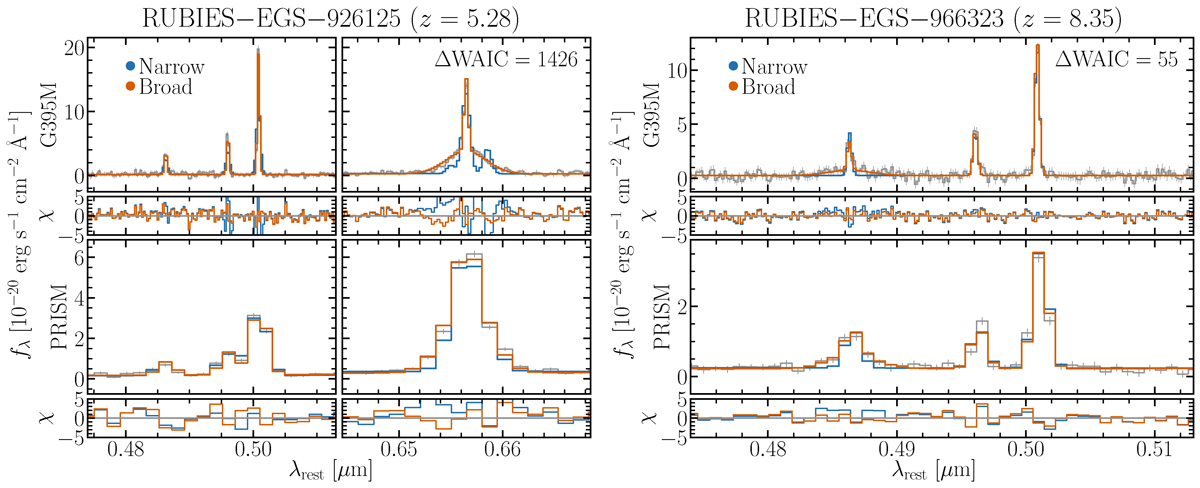
Fig. 2.
Download original image
Zoomed-in images of the spectroscopic fits for RUBIES-EGS-926125 (left) and RUBIES-EGS-966323 (right) using narrow (blue) and broad (orange) models for both G395M (top) and PRISM (bottom) spectra along with their residual deviations. We plot the maximum posterior sample from the MCMC fitting. Simultaneous fitting leverages all available data to constrain linewidths in both gratings across different wavelength regimes. For 926125 we show both the Hβ + [O III] and Hα + [N II] complexes, while for 966323 we only have coverage of the Hβ + [O III] complex. We note that a broad component could not be conclusively fit in 966323 from the PRISM or G395M spectrum alone in Wang et al. 2024 or Kocevski et al. 2025, but is detected in this work at the > 6.5σ level.
Current usage metrics show cumulative count of Article Views (full-text article views including HTML views, PDF and ePub downloads, according to the available data) and Abstracts Views on Vision4Press platform.
Data correspond to usage on the plateform after 2015. The current usage metrics is available 48-96 hours after online publication and is updated daily on week days.
Initial download of the metrics may take a while.