Fig. 6.
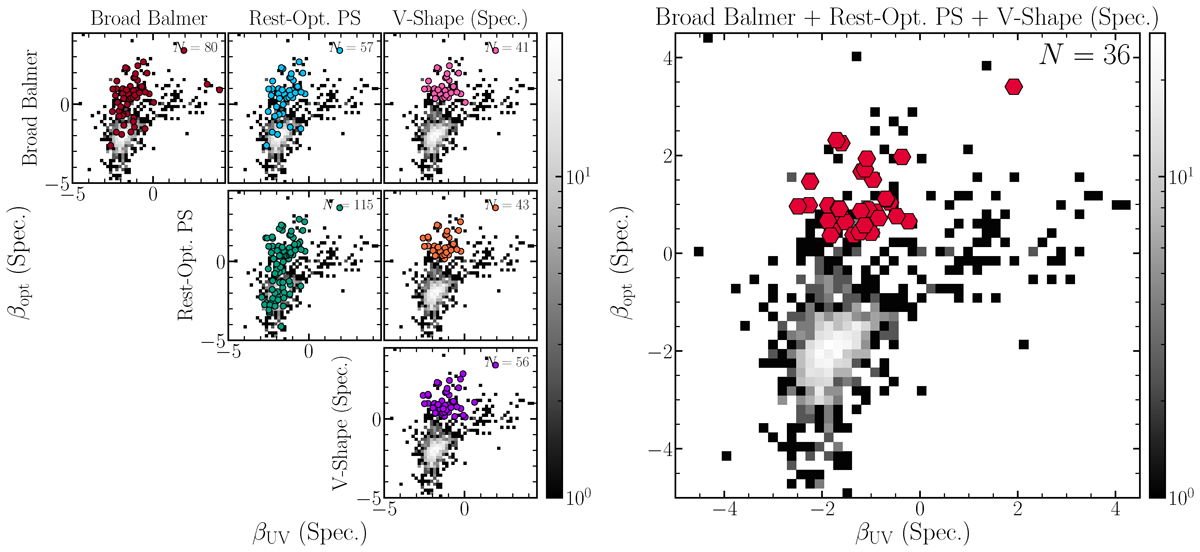
Download original image
βUV − βopt space distribution of RUBIES sources with robust zspec > 3.1 (gray histogram). On the right, we plot objects that satisfy our condition for broad-line, unresolved, and v-shaped features, along with their combinations, above the full distributions of the parent sample. On the left, we plot the objects that satisfy all three criteria. The slopes are derived from PRISM spectroscopy and each panel includes the total number of objects plotted and their fraction of the represented sample. The points are colored as in Figure 7.
Current usage metrics show cumulative count of Article Views (full-text article views including HTML views, PDF and ePub downloads, according to the available data) and Abstracts Views on Vision4Press platform.
Data correspond to usage on the plateform after 2015. The current usage metrics is available 48-96 hours after online publication and is updated daily on week days.
Initial download of the metrics may take a while.