Fig. 1
Download original image
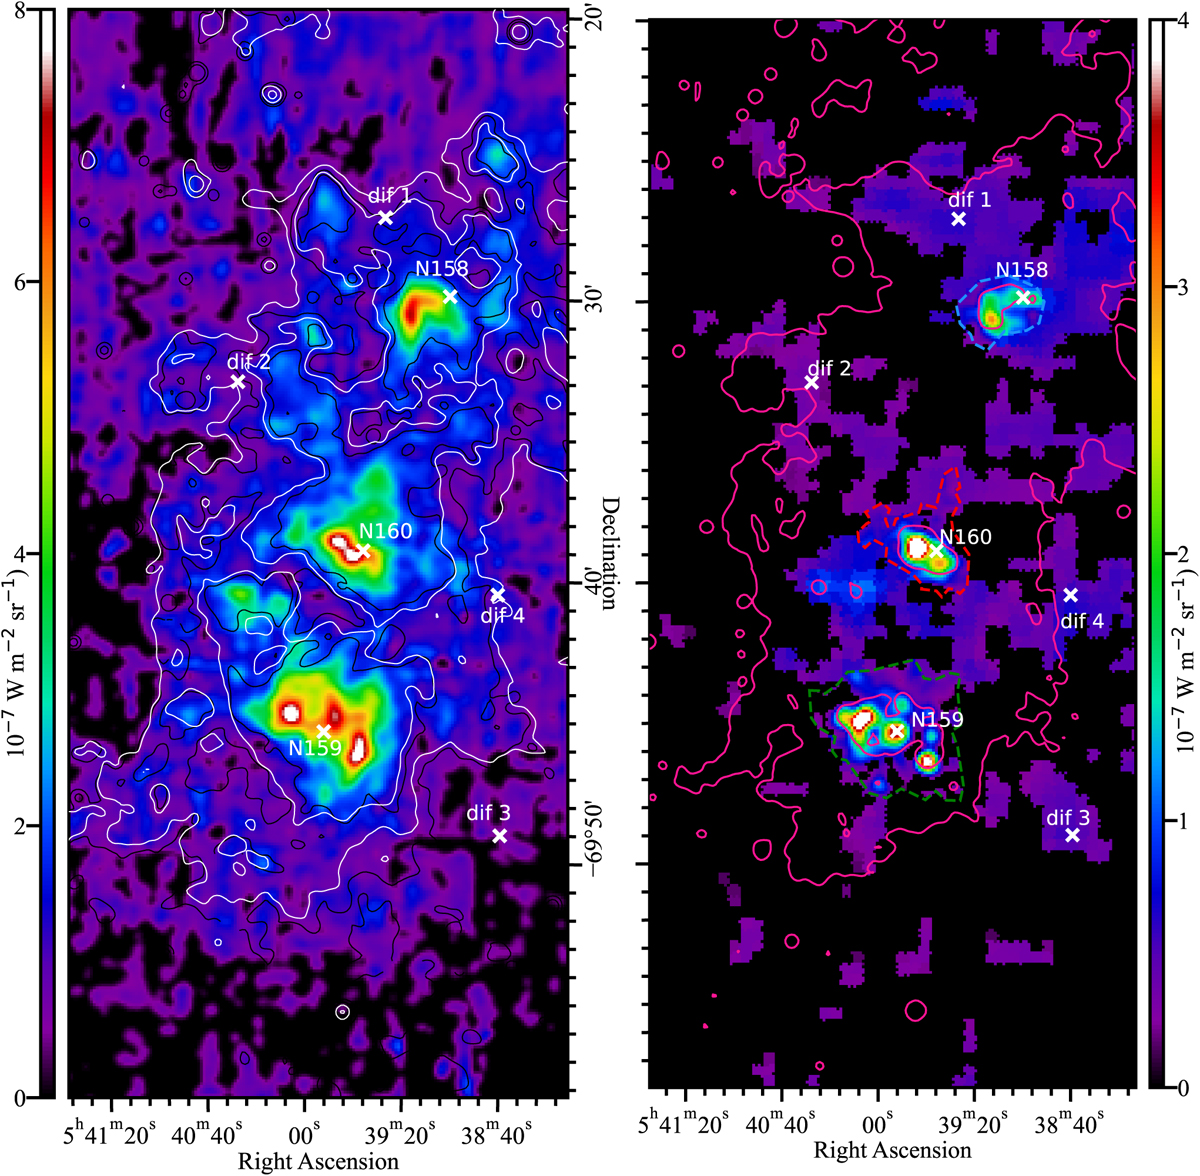
Intensity of the far-infrared fine-structure lines [C II]λ158 µm (left) and [O III]λ88 µm (right) in W m−2 sr−1, observed by SOFIA/FIFI-LS. The intensities are the result of spectral Gaussian fits and only those fits with a S/N ≥ 3 are shown. Pixels with lower S/N are displayed as 0 (in black). The white contours are from LTIR (300 and 600 Lso//pc2) shown in Fig. 3. The thin black contours shown in the [C II] map are 8 µm from Spitzer/IRAC (4 and 8 MJy/Sr). The red contours in the [O III] map are Spitzer/MIPS 24 µm continuum (5 and 150 MJy/sr). The [C II] map is shown in the native resolution with a beam FWHM of 15.3″. The [O III] data in the three bright star formation regions marked by dashed blue, green and red lines was smoothed to the same resolution (15.3″) to increase the S/N per beam. Outside of the regions the data was further re-binned to 24″ and fit within a 48″ beam to further increase the S/N in the diffuse regions. The seven gray crosses, in identical positions in the [C II] and [O III] maps, mark the positions of the spectra shown in Appendix A.
Current usage metrics show cumulative count of Article Views (full-text article views including HTML views, PDF and ePub downloads, according to the available data) and Abstracts Views on Vision4Press platform.
Data correspond to usage on the plateform after 2015. The current usage metrics is available 48-96 hours after online publication and is updated daily on week days.
Initial download of the metrics may take a while.