Fig. 2
Download original image
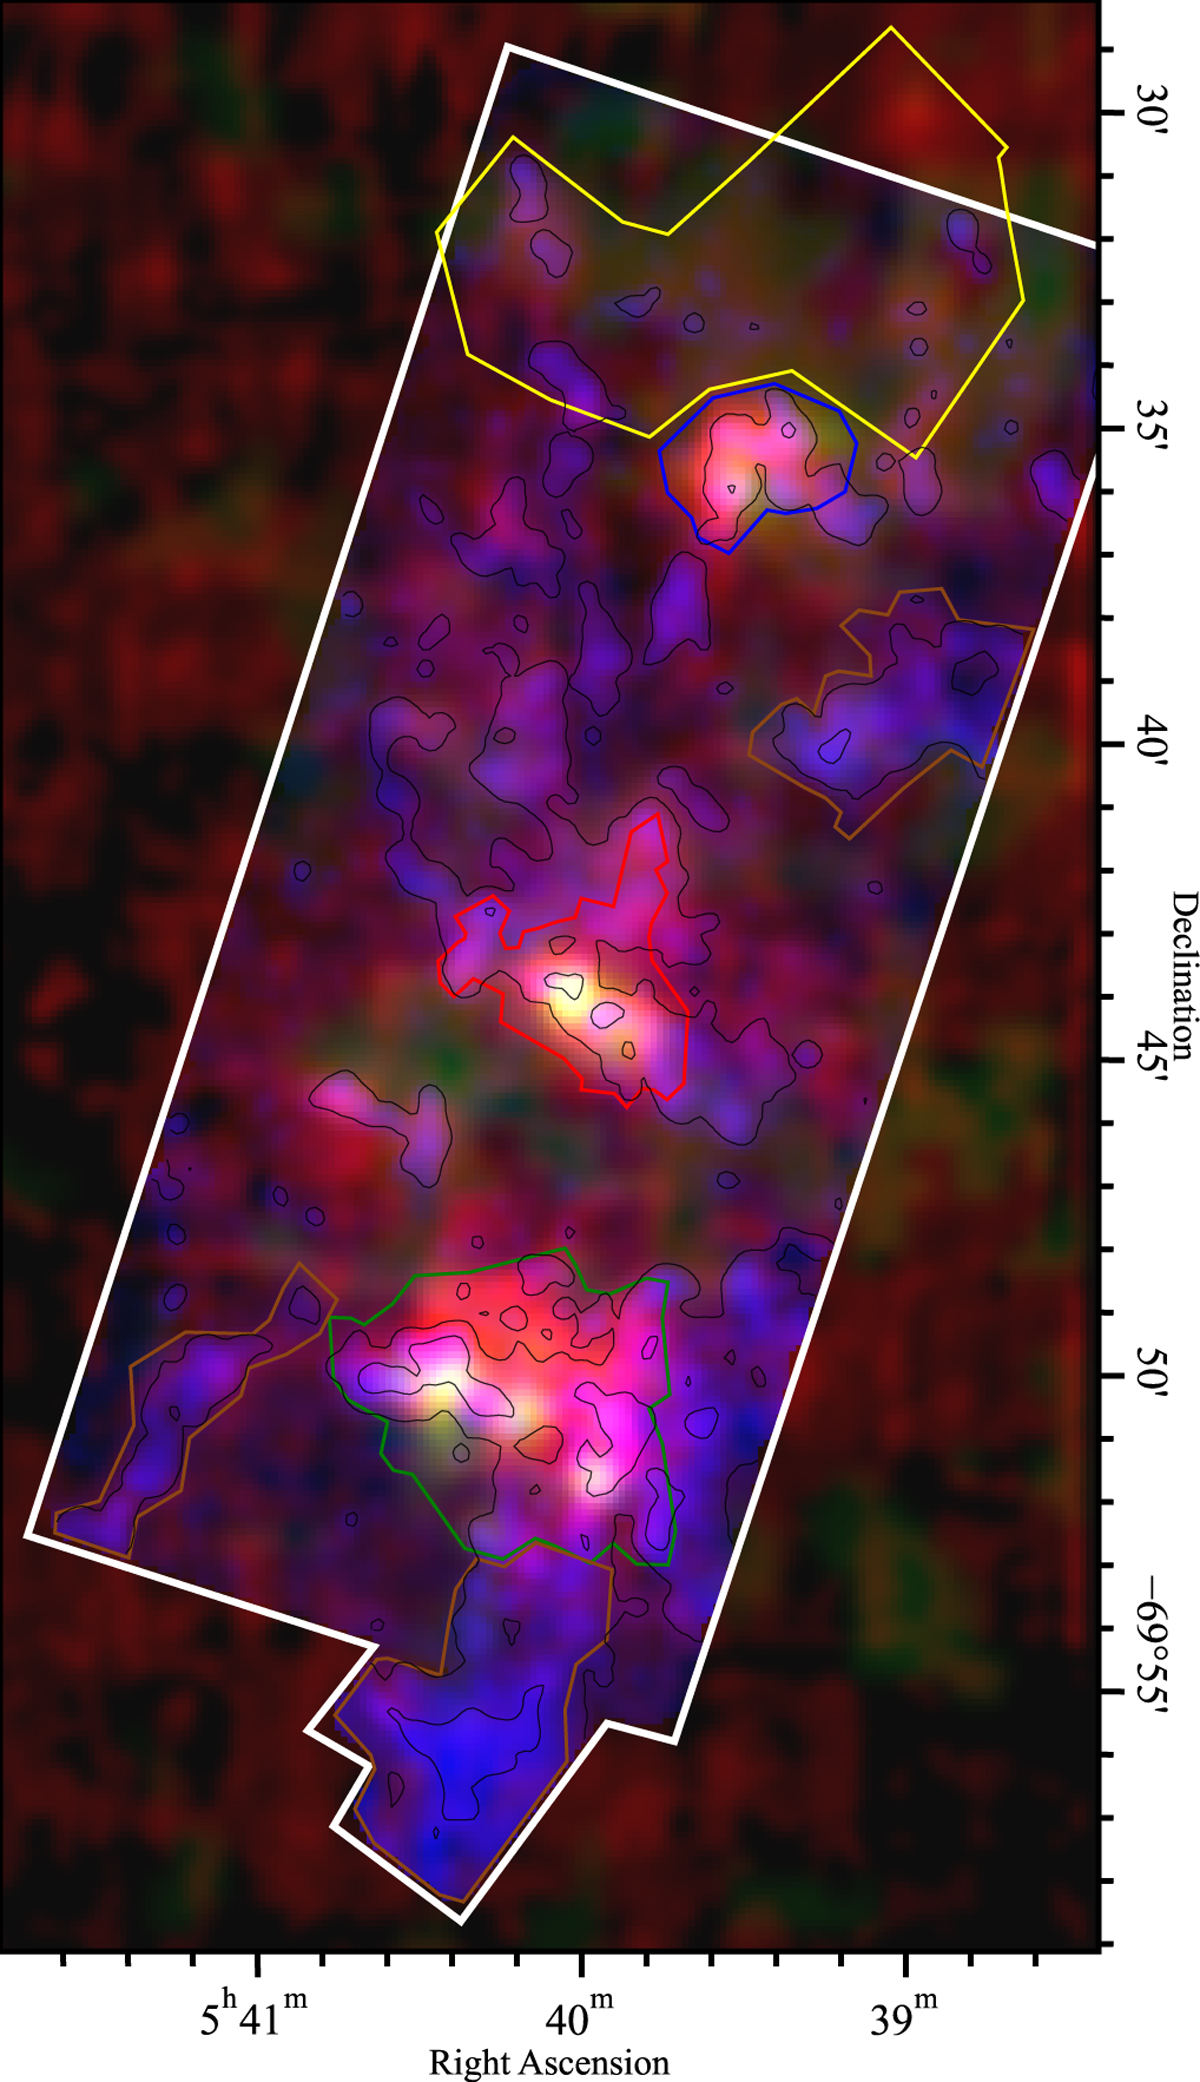
RGB map of [C II] (r), [O III] (g) and 12CO(2−1) (b) from Tarantino et al. (in preparation) and Chen et al. (in preparation), with the map of the 12CO(2−1) outlined in white. Contours are shown for 12CO(2−1) line flux levels of 5 × 10¹¹ and 5 × 10¹⁰ Wm−2 sr−1. Regions for analyses in Sect. 4 are outlined, corresponding respectively to the SFRs, N159(green), N160(red), N158(blue), an extended, less active region in [O III] (yellow) and three CO-bright filaments (brown). They are also referred to in Fig. 3, and in the plots in Figs. 5 and 6.
Current usage metrics show cumulative count of Article Views (full-text article views including HTML views, PDF and ePub downloads, according to the available data) and Abstracts Views on Vision4Press platform.
Data correspond to usage on the plateform after 2015. The current usage metrics is available 48-96 hours after online publication and is updated daily on week days.
Initial download of the metrics may take a while.