Fig. 4
Download original image
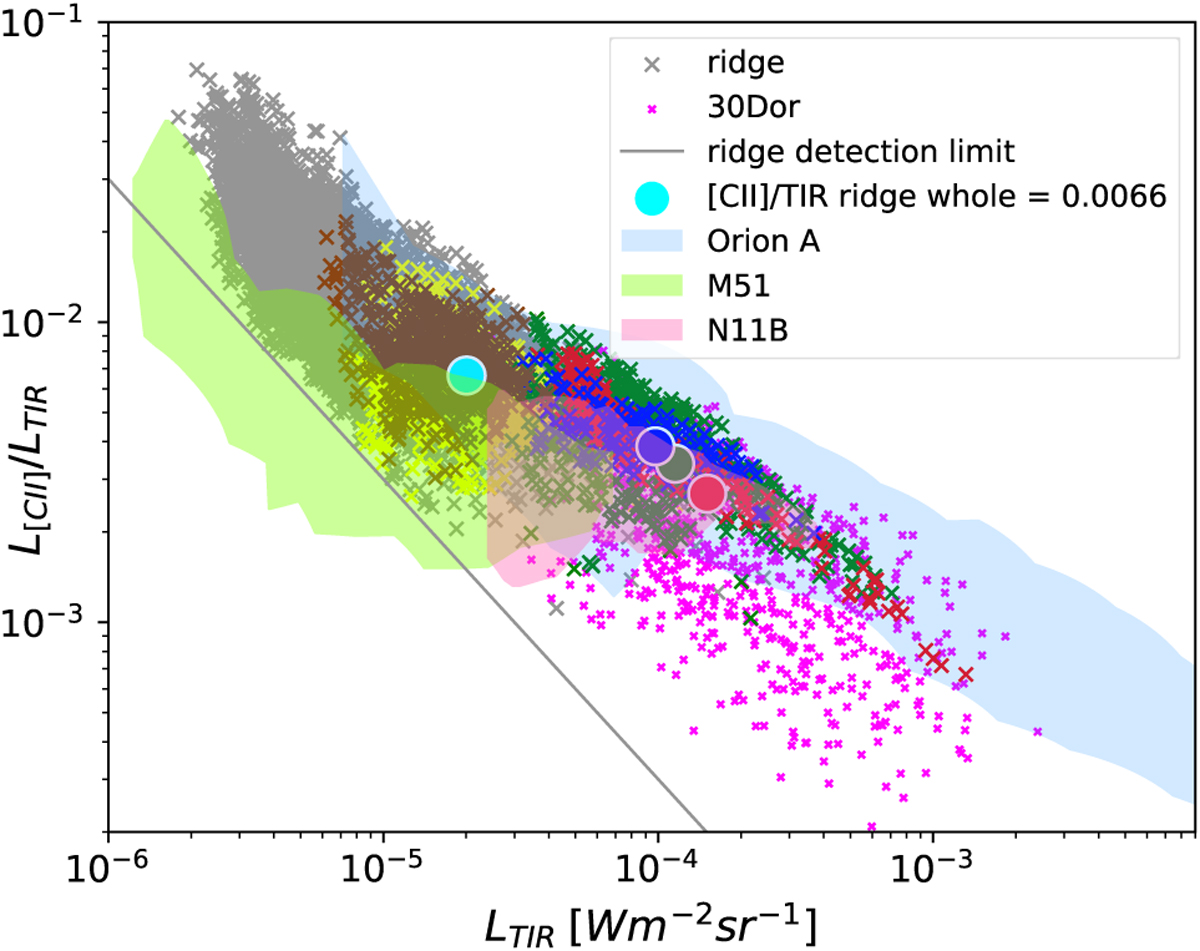
L[C II]/LTIR versus LTIR in the molecular ridge in 12″× 12″ pixels. Yellow, blue, red, green, and brown colors refer to the regions outlined in Figs. 2 and 3. Gray points represent the pixels in the ridge outside of these regions. Data for 30 Doradus from Chevance et al. (2020) is added. The gray line represents the average minimum detectable [C II] line flux for S/N = 3. The large circles represent the ratio values for the whole ridge (cyan) and the three bright SFRs (N158: blue; N160: red; Nl59:green), relative to the mean LTIR. The areas with filled colors represent observations from: Orion A (Pabst et al. 2021); M51 (Pineda et al. 2018); N11B (Lebouteiller et al. 2012).
Current usage metrics show cumulative count of Article Views (full-text article views including HTML views, PDF and ePub downloads, according to the available data) and Abstracts Views on Vision4Press platform.
Data correspond to usage on the plateform after 2015. The current usage metrics is available 48-96 hours after online publication and is updated daily on week days.
Initial download of the metrics may take a while.