Fig. 5
Download original image
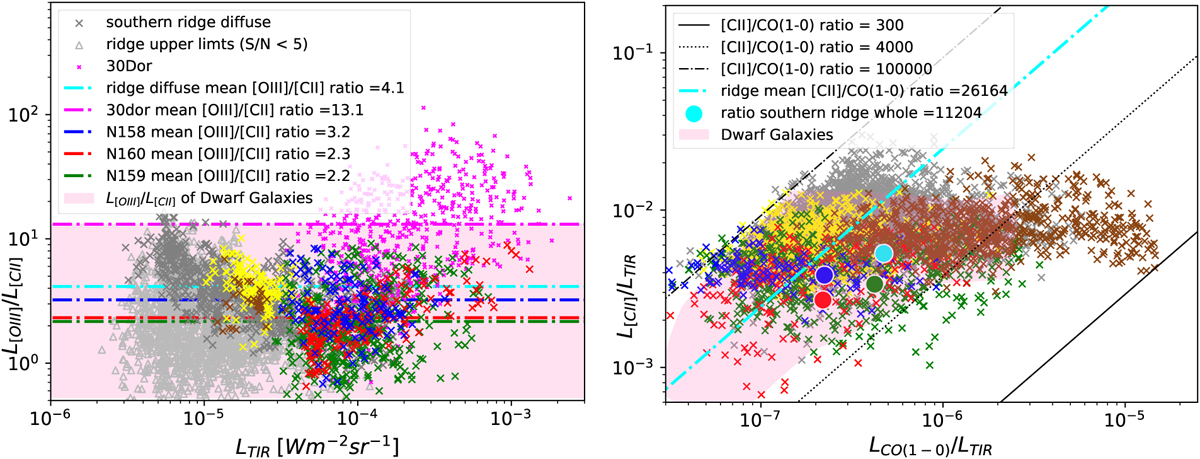
Line ratio plots for the molecular ridge. Yellow, blue, red, green, and brown colors refer to the regions outlined in Figs. 2 and 3. Gray points represent the pixels in the ridge outside of these identified regions. Left: L[O III]/L[C II] versus LTIR in 12″ pixels for the three bright star formation regions and in 24″ pixels for the rest of the molecular ridge, where pixels with S/N below 5 are shown as upper limits. 30 Doradus data points from Chevance et al. (2020) have been added with 12″ binning. The horizontal lines show the mean L[O III]/L[O II] ratio for the regions. Right: L[O II]/LTIR versus L[CO]/LTIR in 12″ pixels. CO(1−0) was estimated from CO(2−1) assuming a ratio of CO(2−1)/CO(1−0) of 0.6 (e.g., den Brok et al. 2021; Maeda et al. 2022). The average ratio (no fit) of L[C II]/LCO(1−0) from the molecular ridge is indicated with the cyan line. The large circles represent the ratios based on the fluxes for the whole regions, in cyan for the whole molecular ridge and in matching colors for the three star formation regions. The area filled in red represents the data range for dwarf galaxies from Madden et al. (2020) using a LTIR to LFIR ratio of 0.6.
Current usage metrics show cumulative count of Article Views (full-text article views including HTML views, PDF and ePub downloads, according to the available data) and Abstracts Views on Vision4Press platform.
Data correspond to usage on the plateform after 2015. The current usage metrics is available 48-96 hours after online publication and is updated daily on week days.
Initial download of the metrics may take a while.