Fig. 6
Download original image
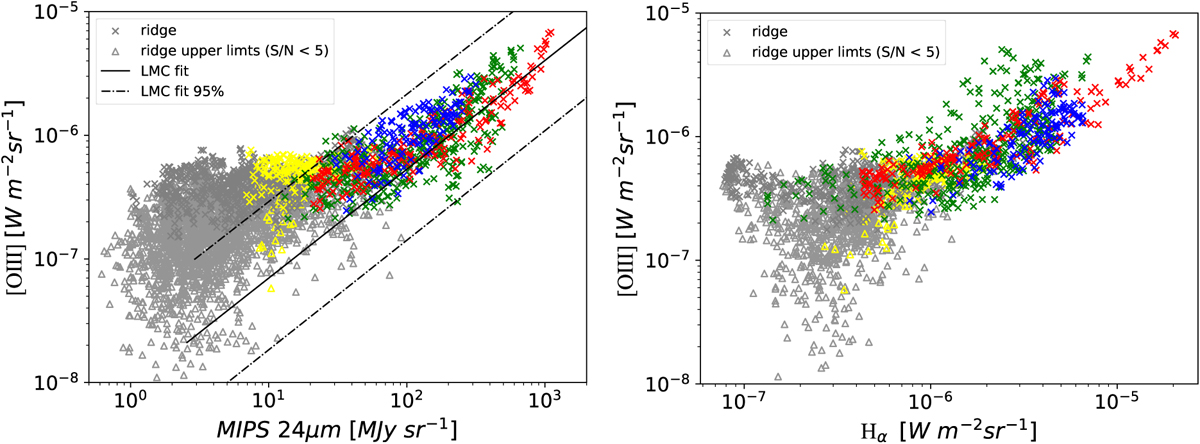
[O III] emission versus 24 µm continuum emission (left) and versus Hα (right) in the three star formation regions in 12″ × 12″ pixels and at 48″ resolution (in 24″ × 24″ pixels) for the rest of molecular ridge map with a detection more than 5σ in both. Yellow, blue, red and green colors refer to the regions outlined in Figs. 2 and 3. Gray points represent the pixels in the ridge outside of these identified regions. For the diffuse regions shown in gray and yellow, fit results with a S/N below 5 are shown as upper limits. The black lines in the left plot show the fit linear relation and the 95% confidence interval from Lambert-Huyghe et al. (2022).
Current usage metrics show cumulative count of Article Views (full-text article views including HTML views, PDF and ePub downloads, according to the available data) and Abstracts Views on Vision4Press platform.
Data correspond to usage on the plateform after 2015. The current usage metrics is available 48-96 hours after online publication and is updated daily on week days.
Initial download of the metrics may take a while.