Fig. A.1
Download original image
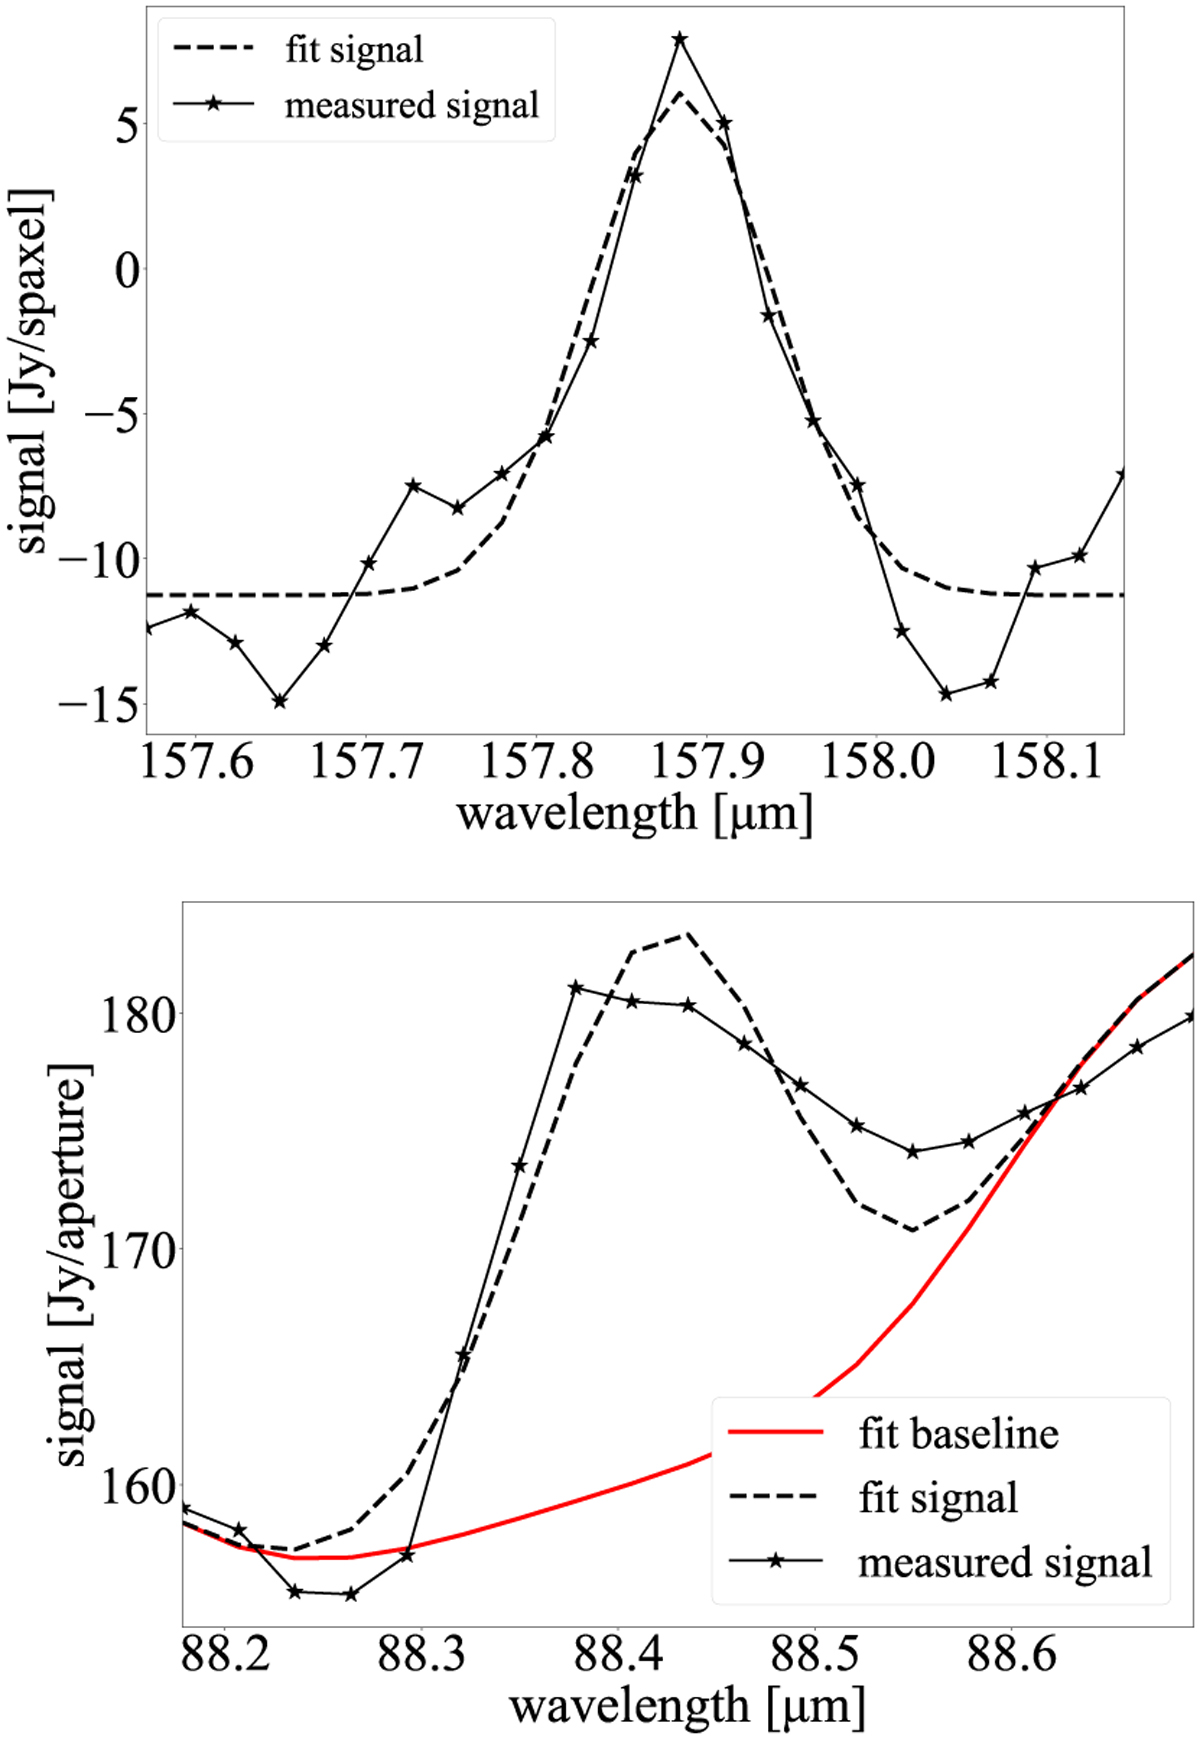
Spectra from location N158 indicated by the crosses in Fig. 1 averaged in apertures drawn around the location with a 15″ diameter. The measured spectra are shown by the connected black stars. The dashed black line shows the fit signal. For the [O III] spectra the fit baseline is additionally shown as a red line. Details of the line fit can be found in section 2.1.3. Top: [C II], Bottom: [O III].
Current usage metrics show cumulative count of Article Views (full-text article views including HTML views, PDF and ePub downloads, according to the available data) and Abstracts Views on Vision4Press platform.
Data correspond to usage on the plateform after 2015. The current usage metrics is available 48-96 hours after online publication and is updated daily on week days.
Initial download of the metrics may take a while.