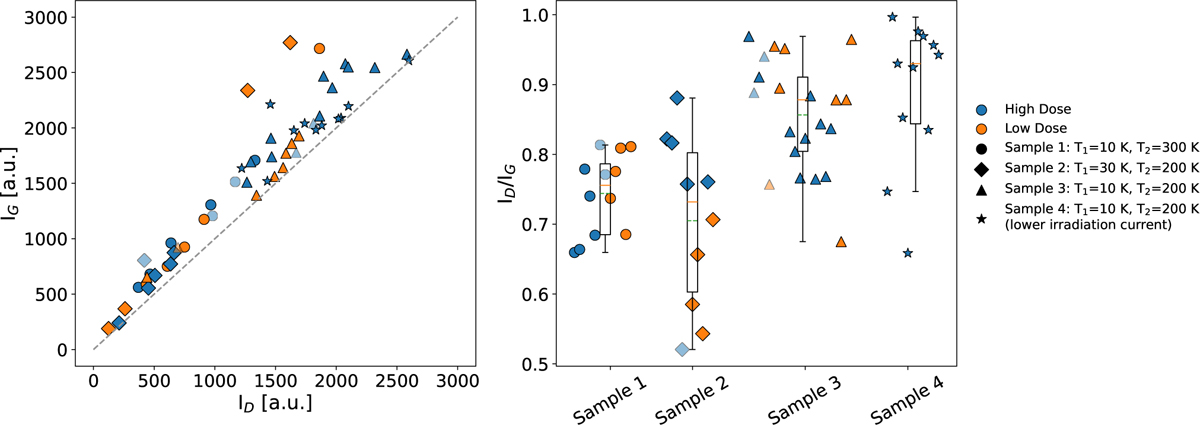
Fig. 5
Download original image
Amplitudes of the Lorentzian fit for the D and G band (left) as well as the ratio of the peak amplitudes ID/IG (right). For the ratios, a we show a boxplot with the minimum, maximum, and the first and third quartile of the values as edges of the box. The orange line represents the median, and the green line shows the mean of the values. The spot measured for sample 4 falling outside of the range is considered an outlier.
Current usage metrics show cumulative count of Article Views (full-text article views including HTML views, PDF and ePub downloads, according to the available data) and Abstracts Views on Vision4Press platform.
Data correspond to usage on the plateform after 2015. The current usage metrics is available 48-96 hours after online publication and is updated daily on week days.
Initial download of the metrics may take a while.