| Issue |
A&A
Volume 702, October 2025
|
|
|---|---|---|
| Article Number | A123 | |
| Number of page(s) | 12 | |
| Section | Planets, planetary systems, and small bodies | |
| DOI | https://doi.org/10.1051/0004-6361/202555840 | |
| Published online | 14 October 2025 | |
The formation of organic macromolecular matter from the electron irradiation of simple carbon-containing ices
1
Space Research and Planetary Sciences, Physics Institute,
University of Bern,
3012
Bern,
Switzerland
2
Faculty of Aerospace Engineering, Delft University of Technology,
Delft,
The Netherlands
3
Institute of Geochemistry and Petrology, Department of Earth and Planetary Sciences,
ETH Zürich,
Switzerland
★ Corresponding authors: This email address is being protected from spambots. You need JavaScript enabled to view it.
; This email address is being protected from spambots. You need JavaScript enabled to view it.
Received:
6
June
2025
Accepted:
18
July
2025
Abstract
Context. Organic macromolecular matter is widespread in the Solar System and is expected to be a dominant carrier of volatile molecules in chondrites. Despite its prevalence in primitive Solar System bodies, its formation pathway is still unclear. Possible scenarios include formation in the interstellar medium, in the early solar nebula, or on planetesimals.
Aims. We investigate the formation pathway of organic macromolecular matter via the energetic irradiation of simple ice analogs, mimicking the composition of an early Solar System ice. The organic macromolecular matter created in this way is suggested to resemble the insoluble organic matter found in primitive Solar System bodies.
Methods. H2O:CH3OH:N2 mixtures were co-deposited at 10 K onto a vacuum grade aluminum foil attached to a copper sample holder, forming an early Solar System ice analog. The ices were irradiated using 5 keV electrons, and after the irradiation, the aluminum foil was heated above the water desorption temperature. The remaining residues were irradiated again, forming organic macromolecular matter. The carbon structure of the residues were investigated using Raman spectrometry. The characteristic D and G band positions and full width at half maxima were compared to results from organic macromolecular matter in meteorites and interplanetary dust particles.
Results. The G band position and full width at half maxima of the investigated residues show similarities to the results obtained by investigating the organic macromolecular matter in interplanetary dust particles. Furthermore, the G band properties indicate that the macromolecular matter formed via the irradiation of simple ice analogs is even more primitive than the matter found in primitive Solar System bodies. Additionally, a tentative dependence on the irradiation temperatures was seen in the G band properties.
Key words: astrochemistry / methods: laboratory: molecular / meteorites, meteors, meteoroids / zodiacal dust
© The Authors 2025
 Open Access article, published by EDP Sciences, under the terms of the Creative Commons Attribution License (https://creativecommons.org/licenses/by/4.0), which permits unrestricted use, distribution, and reproduction in any medium, provided the original work is properly cited.
This article is published in open access under the Subscribe to Open model. This email address is being protected from spambots. You need JavaScript enabled to view it. to support open access publication.
1 Introduction
Organic matter can be found in a number of Solar System bodies, including planetary surfaces, comets, meteorites, micrometeorites, and interplanetary dust particles (IDPs) (e.g. Ehrenfreund & Charnley 2000; Sephton & Botta 2005; Raulin 2008; Cruikshank et al. 2005). It includes a variety of compounds such as hydrocarbons, alcohols, ketones, and macromolecules with a high molecular weight (Llorca 2004). In primitive Solar System objects, such as carbonaceous chondrites and IDPs, organic matter has been shown to make up a large fraction of their composition (Mullie & Reisse 1987; Glavin et al. 2018), with anhydrous IDPs containing on average ∼12 wt% of organic matter (Thomas et al. 1994). For ultracarbonaceous Antarctic micrometeorites, up to 85% of their analyzed surface is composed of organic matter (Duprat et al. 2010). This organic matter can be roughly divided into a soluble and insoluble fraction (Gilmour 2003), which both contain many molecular species (Fray et al. 2017). The soluble organic matter (SOM) is soluble in common laboratory solvents, such as water and ethanol, and more than 500 different molecular species were identified in natural samples (Schmitt-Kopplin et al. 2010, and references therein), among them polycyclic aromatic hydrocarbons (PAHs), sugars, nucleobases, and amino acids (Pizzarello 2007). The insoluble organic matter (IOM), on the other hand, makes up the majority of the carbon-bearing matter. It is the main carrier of atomic carbon, nitrogen, and noble gases in chondrites (Alexander et al. 2017) and mainly consists of macromolecular carbonaceous structures (Remusat et al. 2007). Macromolecular matter has been detected in ordinary and carbonaceous chondrites (Remusat et al. 2007; Sephton 2002; Alexander et al. 1998), in IDPs (Flynn et al. 2008; Clemett et al. 1993), in asteroids (Bonal et al. 2024; Mathurin, Jérémie et al. 2024), and in cometary dust (Bockelée-Morvan et al. 2001; Fray et al. 2016). IDPs, like meteorites and comets, are expected to be important for the delivery of organic molecules to the surface of planetary bodies (Flynn et al. 2008). More than 70% of the carbon content of the Murchison meteorite (CM2) has been classified as IOM (e.g. Vinogradoff et al. 2017), and values of up to 99% are possible for other carbonaceous chondrites (Pizzarello et al. 2006).
The IOM in meteorites can be altered by parent-body processing, including aqueous alteration and thermal metamorphism. This leads to observed differences in IOM composition between different chondrite classes (e.g. Alexander et al. 2007). Furthermore, the analysis of chondritic IOM showed that it displayed characteristics of thermal processing or irradiation (Quirico et al. 2014). IDPs are therefore especially interesting because they are considered to be among the most primitive materials in the Solar System. With the exception of chondritic smooth IDPs, IDPs are thought to have largely remained unaltered since their formation (Bradley 2014). Flash heating when they enter the atmosphere is expected to alter the IOM, however, although the exact amount of heating they experience depends on a multitude of parameters (Riebe et al. 2020). The majority of IDPs are thought to originate from Jupiter-family comets (Carrillo-Sánchez et al. 2016), and fewer than 10% are asteroidal (Nesvorný et al. 2010).
The IOM has been found to be enriched in the isotopes D and 15N compared to other Solar System materials. The D/H ratio reaches values of 1.4 · 10−3 (Fraundorf et al. 1982), and the enrichment of 15N reaches values of up to 260% (Alexander et al. 1998). For the IOM of cluster IDPs, an even larger enrichment was observed, namely a D/H ratio of up to 8 · 10−3 (Messenger 2000). These isotope anomalies in the IOM indicate formation in a cold radiation-rich environment (Robert & Epstein 1982; Charnley & Rodgers 2008). The exact origin of IOM is still debated, however, and it is unclear whether it formed in the interstellar medium (Robert & Epstein 1982; Busemann et al. 2006), in the solar nebula (Hayatsu et al. 1980; Morgan Jr et al. 1991; Kuga et al. 2015), or on planetesimals via Urey-Miller-type reactions (Peltzer et al. 1984).
One promising pathway for the formation of IOM is the irradiation of carbon-bearing ices, which has been shown to lead to the formation of more complex molecules from simple ice analogs (e.g. Kipfer et al. 2024; Bennett & Kaiser 2007; Ligterink et al. 2018), including the formation of an organic residue. Comparing the IOM of IDPs to laboratory analogs like this might help us to constrain the formation mechanism and history of IOM. This is crucial for understanding the complex IOM that is available for planet formation and potential post-formation delivery to the surface of planetary bodies. As IOM is expected to mainly consist of macromolecular structures (Remusat et al. 2007; Derenne & Robert 2010), methods probing the overall structure of a sample are needed. One such method is Raman spectroscopy, which we describe in more detail in Section 2.4. Raman spectroscopy is a broadly used diagnostic technique to investigate the carbonaceous material in meteorites and IDPs (e.g. Wopenka 1988; Busemann et al. 2007; Muñoz Caro et al. 2006).
A number of experimental investigations of the formation of organic macromolecular matter resembling IOM were conducted, mainly using UV photons and ions to energetically process an IOM-precursor (e.g. Strazzulla et al. 1992; Callahan et al. 2013; Nuevo et al. 2011). Fast ions and UV photons are known to break up molecular bonds in the ice, resulting in fragments that can react to form new species (e.g. Yamamoto 2017). Strazzulla et al. (1991) postulated that an ion irradiation dose of 100 eV/molecule was sufficient to form a substantial residue from carbon-containing ices. de Marcellus et al. (2017) showed that the Vacuum ultraviolet irradiation (VUV, 110−180 nm) of an H2O:CH3OH:NH3(3:1:1) ice at 77 K first leads to the formation of SOM, which was heated to room temperature and then again irradiated with VUV photons, forming a thin crust of insoluble organic matter on top of the SOM. Danger et al. (2022) showed that the organic macromolecular matter produced with that experimental protocol displayed similar aromaticities to the primitive carbonaceous Paris meteorite (CM2 chondrite), further strengthening the hypothesis that the irradiation of simple ices might lead to the formation of organic macromolecular matter (Danger et al. 2021). Ferini et al. (2004) used energetic ions to irradiate different carbon-containing ices. They irradiated a pure CH4 ice at 12 K with 30 keV He ions, then warmed it up to 100 K and irradiated it for a second time with either 30 keV He+or 60 keV Ar++. This second irradiation deposited a much larger dose of up to 1000 eV/16 amu into the residue. Raman spectroscopy of the residue revealed a broad band around 1560 cm−1 that appeared for high irradiation doses. This was attributed to the C=C stretching vibration of amorphous carbon. Similarly, the authors also irradiated an H2O:CH4:N2(1:6:3) ice. The position of the band then shifted to higher wavenumbers with an increasing dose. Interestingly, their irradiation of a CH3OH:N2 (1:2) ice resulted in no detectable Raman features corresponding to amorphous carbon. This led them to postulate that doses of 10−100 eV/molecule are sufficient to make the amorphous carbon band visible when hydrocarbons are present in the initial ice. Augé et al. (2016) showed that the irradiation of N2:CH4(90:10 and 98:2) ice mixtures with 44 MeV Ni11+ and 160 MeV Ar15+ led to the formation of a solid residue that displayed similarities to the nitrogenrich carbonaceous matter found in ultracarbonaceous Antarctic micrometeorites. This indicates that the irradiation of simple ices can result in precursors for multiple observed phases of organic macromolecular matter.
UV photons and ions have been frequently used to energetically process simple ices to create an organic residue. Energetic electrons on the other hand were not used extensively to investigate their potential for forming organic macromolecular matter, even though they are expected to play a role in the processing of ices in the outer Solar System (Zhang et al. 2024; Kim & Kaiser 2012; Cooper et al. 2001), and energetic electrons are frequently used as proxies for galactic cosmic rays in ices (e.g. Abplanalp et al. 2018; Marks et al. 2022).
We irradiated H2O:CH3OH:N2(5:5:1) ices in a two-step process using 5 keV electrons. We analyzed the resulting residues using Raman spectroscopy to investigate whether energetic electrons can create organic macromolecular matter and to help understand its overall formation process. The measurements were compared to previous laboratory work, as well as Raman spectra of IOM from meteorites and IDPs. Structural similarities in the IOM and the organic macromolecular matter produced in the laboratory would strengthen the hypothesis that energetic processing of ices is a viable option for the formation of IOM and would lay the groundwork for future experimental work using electrons as a means to form organic macromolecular matter resembling IOM in the laboratory.
2 Methods
2.1 ICEBEAR
The experiments were conducted with the ICEBEAR setup, which was described in detail by Kipfer et al. (2024) and is shown in Figure 1. Briefly, the setup consists of a stainless steel vacuum chamber that is pumped by a turbomolecular pump (MAG W400iP, Leybold), backed by an oil-free roughing pump (ScrollVac SC 15 D, Leybold). It reaches a base pressure of about 10−8 mbar at room temperature, with pressures below 5 · 10−9 mbar when the cryostat is in use. The pressure within the chamber is monitored using a PKR 261 pressure gauge (Pfeiffer Vacuum), read out with a TPG 252 A controller (Pfeiffer Vacuum). On top of the chamber, an electron gun (EQ 22/35, Specs) is mounted with which the samples can be irradiated.
Ice samples are grown in situ on vacuum-grade aluminum foil that is placed on top of a copper sample holder, using a copper ring to ensure thermal contact between the foil and the sample holder. The sample holder is mounted on the cold head of a closed-cycle helium cryostat (RDK-408D2 coldhead in combination with a F-50H compressor, Sumitomo Cryogenics), allowing for cooling of the sample holder down to ∼5 K. The temperature of the sample holder is monitored with an Si diode (DT 670-CU, Lakeshore) attached to a cavity on the underside of the sample holder via a screw and the temperature is recorded by a temperature controller (Lakeshore Model 336). Two heating rods are mounted in the sample holder, allowing for resistive heating of the sample holder via the temperature controller, using a closed-loop proportional-integral-derivative (PID) control.
Gas mixtures are prepared in an independently pumped gas mixing system that consists of stainless-steel crosspieces. The gas-mixing system is pumped via a Turbopump (HiPace 80, Pfeiffer Vacuum), backed by an oil-free roughing pump (MV 2 NT, Vacuubrand, Pfeiffer Vacuum). The pressure within the gas-mixing system is monitored using a capacitance diaphragm pressure gauge (CMR 362, Pfeiffer Vacuum), which measures the absolute gas pressure independent of the gas species. Up to three gas bottles and two vials containing liquids can be attached to the gas-mixing system, each with its own connection to the mixing volume of the system. Liquids connected to the gas-mixing line are vaporized upon expansion into the gas-mixing volume and are purified before mixing by several freeze-pump-thaw cycles using liquid nitrogen. The desired mixtures are prepared by add-mixing and are then introduced into the chamber via a manually operated valve for gas deposition (Valve All Metal Leak, VML14CFR35, Hositrad), where they condense onto the cooled-down sample holder due to background deposition.
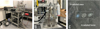 |
Fig. 1 (A) ICEBEAR setup. (B) EQ 22/35 electron gun mounted on top of the chamber. (C) Example of the irradiated spots on the aluminum foil after the foil was removed from the chamber. |
2.2 Measurement procedure
We investigate the energetic processing of H2O:CH3OH:N2 ices using 5 keV electrons to test whether electrons can be used to create organic macromolecular matter. Energetic electrons are commonly used as proxies for the secondary electrons produced by the interaction of cosmic rays with matter (e.g., Holtom et al. 2005; Abplanalp et al. 2018; Marks et al. 2022), and the secondary electrons are thought to play an important role in driving the chemistry in the ice (Arumainayagam et al. 2019), where they shape the (near) surface of outer Solar System objects such as KBOs (Zhang et al. 2024; Kipfer et al. 2024). Furthermore, previous research on interstellar ice analogs has shown that similar irradiation products are formed when ices are irradiated via electrons, UV photons, or heavy ions, although quantitative differences are apparent (e.g. Muñoz Caro et al. 2014; Abplanalp et al. 2018; Baratta et al. 2002). H2O and CH3OH are found in the interstellar medium, in protoplanetary disks, and in cold molecular clouds (Herbst & van Dishoeck 2009; McClure et al. 2023). CH3OH can even make up to ∼30% of the water-ice abundance (Boogert et al. 2015). N2 was detected in the cometary coma of 67P/Churyumov-Gerasimenko (Rubin et al. 2015) via in situ measurements. As it does not have a permanent dipole, N2 usually evades detection via radio and infrared observations and is therefore elusive in the interstellar medium, in protoplanetary disks, and molecular clouds. It was detected on the surface of a number of Kuiper Belt Objects, such as on Pluto (Owen et al. 1993) and Triton (Cruikshank et al. 1993), however, and tentatively on Eris and Makemake (e.g. Tegler et al. 2007; Lorenzi et al. 2015). It serves the function of a nitrogen donor in the present ice mixture, even though NH3 might be more representative for a protoplanetary ice. NH3 is corrosive, however, and would be harmful to the gas-mixing system in its current form. We will therefore install a separate gas-mixing line in the future to use ammonia.
For all experiments, the sample holder was initially cooled to T=10 K. The gas mixtures were prepared in the gas-mixing system using H2O (MilliQ grade water, produced with a local Millipore System), CH3OH (Sigma Aldrich), and N2(99.999%, Messer). A mixture of H2O:CH3OH:N2(5:5:1) was prepared and leaked into the chamber via the manually operated needle valve at pressures of 4 × 10⁻⁶ mbar for 1333 s, which led to the formation of amorphous and likely highly porous ices (Fayolle et al. 2016) with an estimated thickness of ∼4000 Langmuir (L) on the aluminum foil. We approximated 1 L to one monolayer (ML) of material, which is 1015 moleculescm−2. This would lead to an ice thickness in the order of 1.5 μm.
The electron beam was deflected to irradiate different spots on the ice. Three different spots were irradiated with 5 keV electrons at a current of 3 μA for 30 min (or 1 μA for 90 min, resulting in the same dose). Depending on the experiment, the ice was either first irradiated at the deposition temperature of 10 K, or the sample holder was heated to 30 K at a heating rate of 2 K min−1 before the irradiation. During the first irradiation, the three spots received an identical dose, which led to the formation of soluble organic matter analog (SOMA), following the naming convention by Danger et al. (2022). The ice was then heated at a rate of 2 K min−1 to the respective temperature for the second irradiation of either 200 or 300 K, depending on the experiment, which is higher than the sublimation temperature of H2O, CH3OH, and N2. The second irradiation therefore took place in an ice-free environment and accordingly only involved organic material that formed during the first ice irradiation. The heating from 200 to 300 K might lead to additional chemical reactions in the residue and in return result in differing Raman signatures. A schematic of the process occurring over the course of the experiment is shown in Figure 2.
One spot was not irradiated for a second time and therefore acted as a control, one spot was irradiated with 1 μA for 30 min, and the third spot was irradiated with 3 μA for 30 min, corresponding to a low dose and high dose, respectively. This distinction between low and high dose is relative to each other. The dose is discussed in more detail in Section 2.3. Details of the experimental conditions are shown in Table 1. All experiments we conducted, whether for singly or doubly irradiated spots, produced a residue, but they varied in appearance (see panel C in Figure 1). The samples were retrieved from the chamber at room temperature, and the aluminum foils were stored in a transport box under vacuum until Raman analysis at the ETH Zürich. Even though oxidation likely affects the Raman signatures of the resulting residue, meteoritic IOM has generally also been exposed to air before and after extraction. Therefore, air exposure is likely a negligible factor in the potential differences between the Raman signatures of laboratory samples and meteoritic IOM. Nevertheless, investigating the Raman signatures in situ and under vacuum would be an interesting future study.
 |
Fig. 2 Schematic illustration of the measurement principle. First, the H2O:CH3OH:N2 ice is irradiated at low temperatures T1 at a current I1 for a time t1, which leads to the formation of a soluble organic matter analog. The sample is then heated above the water sublimation temperature to a temperature T2 and irradiated at a current I2 for a second time t2, resulting in the formation of organic macromolecular matter from the soluble organic matter analog. The aluminum foil is not displayed in the schematic. The schematic is adapted in part from Danger et al. (2022). |
Overview of the irradiation experiments performed on a H2O:CH3OH:N2(5:5:1) ice and resulting SOMA.
2.3 Dose calculation
The dose D was calculated using the following formula (Förstel et al. 2016):
 (1)
with the current I, the irradiation time t, the mean molecular mass m, the electron charge e, the density of the ice ρ, the irradiated area A, the average penetration depth l, and the initial electron energy Einit. This resulted in a dose of eV/molecule. The average penetration depth, the fraction (ftrans and fbs), and the energy (Etrans and Eb s) of backscattered and transmitted electrons were derived with the software Monte Carlo simulation of electron trajectory in solids (CASINO) (Drouin et al. 2007), which is a well-established procedure to simulate the electron irradiation of ices (see, e.g., Barnett et al. 2012; Zhou et al. 2014; Förstel et al. 2016).
(1)
with the current I, the irradiation time t, the mean molecular mass m, the electron charge e, the density of the ice ρ, the irradiated area A, the average penetration depth l, and the initial electron energy Einit. This resulted in a dose of eV/molecule. The average penetration depth, the fraction (ftrans and fbs), and the energy (Etrans and Eb s) of backscattered and transmitted electrons were derived with the software Monte Carlo simulation of electron trajectory in solids (CASINO) (Drouin et al. 2007), which is a well-established procedure to simulate the electron irradiation of ices (see, e.g., Barnett et al. 2012; Zhou et al. 2014; Förstel et al. 2016).
The equation has the downside of employing a mixture of variables to it, such as an average density (ρ=0.97 gcm−3 as an approximation for a H2O:CH3OH ice, Jones et al. 2014; Bouilloud et al. 2015) and a mean molar mass (in this case, m ≍ 16 g/mol due to calculation per oxygen atom), which only gives a first-order estimate on the dose. To compare the values with previous work on the irradiation of planetary and interstellar ice analogs (e.g. Kipfer et al. 2024; Förstel et al. 2016), however, we used this formula to ensure consistency.
The spot size of the irradiated areas is slightly elliptical due to deflection of the electron beam. We determined the spot size via computer-aided visual inspection of a microscope image of the residue, which were in the range of 2.47 mm2 and 7.59 mm2 (for the highly elliptical spot size) and 3.19 mm2 to 8.77 mm2 (for a more circular spot size). It is difficult to determine the irradiation spot edges and subsequently the size exactly, which leads to the uncertainty. Furthermore, the residue appears to be inhomogeneous; the middle part appears to be darker. This might indicate a charge buildup within the ice at this small spot size, which might lead to a slight deflection of the electrons. This would have to be investigated further, however.
An order-of-magnitude estimate based on Equation (1) yielded 1000−4000 eV/16 amu for the first irradiation (duration 30 min, current 3 μA, uncertainty depending on the effective spot size). The dose during the second irradiation was challenging to calculate due to the absence of ice and the unknown thickness, composition, and density of the residue. The penetration depth of the electrons might therefore exceed the thickness of the residue and might subsequently also heat the aluminum foil. Only a very rough order of magnitude estimate was therefore calculated for the second dose, and the samples were assigned the labels high and low dose, based on the relative second dose. Using a residue density of 2 gcm−3 (de Marcellus et al. 2017), assuming that from the 1.5 μm thick ice 5% is efficiently transformed into residue, and further assuming that the electrons penetrate the entire sample and neglecting the backscattering, we obtained an upper limit on the second dose between 1000–4000 eV/16 amu (low dose, depending on assumed spot size) and 3000−12000 eV/16 amu (high dose). This matched the dose from the first irradiation, at least. This number should be treated with care and as a first-order estimate on the dose, however.
2.4 Raman spectroscopy
Raman spectroscopy is a spectroscopic tool that yields information about the molecular structure of an analyte. The technique is based on Raman scattering, which is the inelastic scattering of photons as they interact with matter. It results in an exchange of energy and a change in the direction for the photon. This change in energy depends on the vibrational modes of the molecular bonds or crystal lattices in the analyte, and it therefore gives information about its structure (Atkins 2006). The technique is especially sensitive to the electronic configuration of carbon atoms, which makes it a valuable tool for studying the structural order of carbonaceous material, such as for the IOM extracted from meteorites and similar minor bodies (Busemann et al. 2007). Furthermore, Raman spectroscopy is often used as a complementary tool to infrared spectroscopy because the latter is not sensitive to species such as N2 or O2 (e.g. Ehrenfreund & van Dishoeck 1998), which can be observed using Raman spectroscopy (e.g. Rouillé et al. 1992).
The D and G bands observed with Raman spectroscopy are of special interest for carbonaceous material. The D band (disordered) appears at ∼1360cm−1 and originates from the A1 g symmetry of a disordered graphitic lattice. This lattice vibrational band is only accessible if there is a defect present in the lattice. The G band (graphitic) is found at ∼1580cm−1 and is associated with the lattice vibration of ideal graphene (Sadezky et al. 2005). This label is misleading, however, because the origin of the band is associated with sp2 paired carbon atoms (Ferrari & Robertson 2000) and the band can also be observed in amorphous carbon (Muñoz Caro et al. 2006). For the D and G bands, the full width at half maximum (FWHM) is considered diagnostic of the maturity of the carbon. Namely, the FWHM of the G and D bands increases as the order of the carbonaceous matter decreases. Furthermore, the G band position is related to the structural type of carbon (Muñoz Caro et al. 2006) and is independent of the laser wavelength used in the Raman spectrometer (Antunes et al. 2006).
We collected Raman spectra using a micro-Raman Spectrometer (DILOR LabRAM), equipped with a microscope (Olympus). The Raman spectrometer uses a 532 nm laser to irradiate the samples. The aluminum foils were placed under the microscope, which was connected to a camera to verify the location of the laser spot. The Raman spectrometer was calibrated using a silicon reference peak at 520 cm−1 and a diamond reference peak at 1332 cm−1. A range of 800−2000 cm−1 was scanned. This is the typical range in which the D and G bands are found, but the 2D band of graphene-like carbon (Hiura et al. 1993) is missed by this range. For each Raman measurement, we collected eight spectra with an integration time of 1 s each, using a laser power of ∼55 μW. This led to a total of 8 s of irradiation by the laser, which was previously determined to not degrade the carbon samples significantly, as this was only observed to occur after 40 s of integration time in the current setup, as determined by the limits set in Jakubek & Fries (2023).
2.5 Fitting Raman spectra
The Raman spectra were fit using a code developed at ETH Zürich by Nicola Allen (Allen 2024). The code takes a Raman spectrum as input and performs the following steps:
Remove spikes in the spectra caused by cosmic rays hitting the detector.
Baseline estimation and subtraction using asymmetric leasts-quares smoothing.
Gaussian filtering to clean up curves for an automatic identification of the peaks.
Estimation of peak parameters (height, center, and width) for a Lorentzian curve fitting.
Fit Lorentzian curves to the data and calculate the residuals.
Plot the Lorentzian curves over the data and plot the residuals.
The fitting of the Lorentzian curves allows us to extract the relevant parameters for the D and G bands, such as center, amplitude, and FWHM, by fitting two Lorentzians of the form
 to the baseline-corrected data. Here, I is the amplitude, γ is the width parameter (sometimes denoted by σ), and v0 is the peak position. The FWHM was calculated via
 The outputs of the fitting, including the peak position, FWHM, and intensity of the D and G bands, were further used to characterize the residues.
3 Results
3.1 Overview of the measurements
Figure 3 shows the raw Raman spectra of a singly and double irradiated sample before any data processing, as described in Section 2.5. Figure 4 shows the normalized baseline-subtracted Raman spectra taken of various spots on the residue labeled sample 1 in Table 1. The figure shows the shape of the Raman spectra and their difference between spots measured on the same residue. Additional spectra for samples 2, 3, and 4 are collected in Appendix A. Generally, the G band peak is better defined than the Dband peak, and the two peaks are poorly separated. This is typical for Raman signatures of amorphous carbon (Busemann et al. 2007). Figure 5 shows the intensities of the fitted D and G band peaks measured for the residues and the distribution of the peak amplitude ratio ID/IG. The ratio was suggested to be a useful indicator for the metamorphism experienced in extraterrestrial carbon (Wopenka 1988; Quirico et al. 2003). Sample 1 showed the smallest spread in ID/IG ratios, whereas sample 2 showed the largest spread. Interestingly, for sample 2, the residue irradiated with a low dose showed a lower ID/IG ratio than the residue irradiated with a high dose. This trend is not observed for the other samples. For samples 1 and 3, the low and high dose cannot be distinguished based on the ID/IG ratio, but sample 3 shows a slight trend toward higher doses with a lower ID/IG ratio. Sample 4, for which only the high dose was measured, also showed a large spread in the ID/IG ratios, although the results agree with the spread of data observed for sample 3. The ID/IG ratio was lower than one for all measured samples, indicating that the G band peak was always more prominent than the D band peak.
Figure 6 shows the D and G band peak positions and FWHM of the different samples. Similar to the intensity ratios, no consistent difference can be seen between high and low doses in the G band parameters. For the D band parameters, no distinction between the irradiation dose can be seen, but there appears to be an overall decrease in the FWHM with increasing D band position. For sample 1, the G band peak position does not significantly change, but the FWHM decreases for the higher irradiation dose. Similarly, for sample 3, the spread of the peak position seems to be consistent between the high and low doses, but the FWHM appears to decrease again as the irradiation dose increases. For sample 2, the opposite appears to be true, as the peak position shifts slightly to the higher wavenumbers for a higher irradiation dose and the FWHM increases, although the spread of the peak position and FWHM for the low dose is very large and it is difficult to compare it to the high dose. Sample 2 was irradiated at a higher temperature for the initial irradiation, whereas for samples 1 and 3, the second irradiation temperature was varied. The same trends can also be tentatively observed in the D band, but the peak position was also affected there.
The high dose of samples 3 and 4 should have received a similar total dose, but sample 4 was irradiated at a lower current for a longer duration. We note that the second irradiation of sample 4 had to be cut short due to technical difficulties with the electron gun, however. Nevertheless, the Raman parameters show similar values and spread for the two samples (excluding the two outliers for sample 4, which were Raman spectra collected on a black carbonaceous mass and therefore different from the bulk sample), indicating that the current variation affected the sample very little and that heating of the sample due to the higher current in the first irradiation might be negligible.
Figure 7 shows the dependence of the G band on the temperatures at which the irradiation took place. For T1=30 K, a tentative trend emerges for the G band to be broader and located at lower wavenumbers. For the residue irradiated at T1=10 K and T2=300 K, the G band parameters are much less spread out than for the other irradiation temperature combinations, with the G band being narrower and situated at lower wavenumbers.
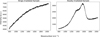 |
Fig. 3 Raman spectra of the residues of sample 1, singly irradiated (left), and doubly irradiated at the high dose (right). The spectra were not baseline corrected to show the shape of the background. The left panel shows a prominent fluorescence signal. In the right panel, the D band is visible at around 1360 cm−1, and the G band can be observed at around 1560 cm−1. |
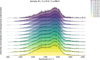 |
Fig. 4 Raman spectra of different spots from sample 1. HD indicates that the residue has received a high dose, and LD indicates a low dose. The D band is visible at around 1360 cm−1, and the G band can generally be observed at around 1560 cm−1. |
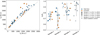 |
Fig. 5 Amplitudes of the Lorentzian fit for the D and G band (left) as well as the ratio of the peak amplitudes ID/IG (right). For the ratios, a we show a boxplot with the minimum, maximum, and the first and third quartile of the values as edges of the box. The orange line represents the median, and the green line shows the mean of the values. The spot measured for sample 4 falling outside of the range is considered an outlier. |
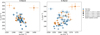 |
Fig. 6 Full width at half maximum Γ of the D and G band as a function of the peak center ω for the different samples investigated with the Raman spectrometer. The samples are colored based on the dose. The semitransparent marker indicates that the Raman spectrum was measured on what might be considered the rim of the sample. |
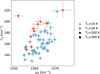 |
Fig. 7 G band peak position and FWHM as a function of the irradiation temperatures. |
3.2 Comparison with literature values
Figure 8 compares the G band parameters to literature values of IDPs, chondritic IOM, and other ion irradiation laboratory experiments. A trend in the literature values can be observed, with more primitive IOM tending toward lower ωG values and higher ΓG, with the IOM extracted from meteorites resulting in higher ωG and lower ΓG values than IDP IOM (e.g. Busemann et al. 2007). The G band parameters we derived from the residues are located at lower wavenumbers and higher FWHM than the literature values for IDP IOM. This indicates that an even more primitive version of carbon was created in our study. Ferini et al. (2004) analyzed organic macromolecular matter created by ion irradiation of H2O:CH4:N2(1:6:3) and pure CH4 ices. The G band parameters in their study were located at even lower wavenumbers than our measurements for residues, but the spread in the FWHM is similar. The laboratory measurements that agree best with the results from this study are the amorphous carbon grains after irradiation with ions measured by Mennella et al. (2004). Furthermore, the results by Bonnet et al. (2015), who measured the carbonization of a HCN polymer (denoted by HCN in the figure legend) and a tholin analog were similar to the measured Raman parameters for this study. In their work, the precursors were degraded in an argon atmosphere at 300, 500, 700, and 1000°C. Those most similar to the measurements were the HCN polymer after being heated to 700°C and the tholin analog after being heated to 300°. No data corresponding to the unheated samples were reported in their paper.
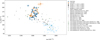 |
Fig. 8 G band parameters compared to Raman data in the literature, including previous laboratory measurements and Raman measurements from meteoritic and IDP IOM. The meteoritic IOM data comes from Busemann et al. (2007); Quirico et al. (2018); Potiszil et al. (2021), the IDP data from Davidsson (2021); Busemann et al. (2009); Chan et al. (2020); Ferini et al. (2004); Caro et al. (2008) and the laboratory data from Baratta et al. (1996); Mennella et al. (2004); Ferini et al. (2004); Bonnet et al. (2015); Couturier-Tamburelli et al. (2024). |
3.3 Heating of the residues
The IDP and meteorite parent bodies experience thermal and hydrothermal processing, which is expected to affect the structure of the IOM, among other effects, and is therefore likely reflected in the D and G band parameters (Busemann et al. 2007). Furthermore, IDPs are expected to experience flash heating during their entry into the atmosphere, which also alters the Raman characteristics of macromolecular organic matter (Riebe et al. 2020). Consequently, a test was performed to investigate the effect of heating on a laboratory residue, and the resulting change in Raman parameters was measured. For this purpose, a H2O: CH3OH: N2 (5:5:1) residue was irradiated twice, once at 10 K and once at 200 K, both times with 3 μA for 30 min. Five spots on the residue were measured. After a period in storage under vacuum, the aluminum foil with the residue was placed in an oven and heated for 1 hour at 180°C. We then measured five additional spots. Figure 9 shows the pre- and post-heating Raman bands. For the G band, a clear shift toward higher wavenumbers can be seen in the post-heating residue. The same holds for the D band for four measured spots, where an increase in wavenumber is observed. For one spot, a decrease was observed, but because this is the same spot that shows a significant decrease in the FWHM in the G band, it might be an outlier. For the D band, a slight decrease in the FWHM was observed after heating, whereas for the G band, the FWHM (with the exception of the likely outlier) stayed constant. These observations are similar to the results obtained by Riebe et al. (2020), who showed that the flash heating of meteoritic IOM, which simulates the conditions IDPs and micrometeorites experience during atmospheric entry, can lead to a change in the G band characteristics of the carbon in the IOM. Specifically, they reported that the G band peak becomes narrower and shifts toward higher wavenumbers. The D band characteristics were less affected by flash heating in the work by Riebe et al. (2020) and did not show any remarkable changes. This is a contrast to our findings, in which an increase in the ωD was seen. Furthermore, when investigating IOM from meteorites, Busemann et al. (2007) reported a decrease in both ωD and ΓD with increasing thermal processing, which is again in contrast with the findings for the residue in this work.
4 Discussion and outlook
To our knowledge, this is the first study that used Raman spectroscopy to investigate organic macromolecular matter resembling IOM produced in the laboratory from the processing of simple ices using energetic electrons. Our comparison of the D and G band parameters of the organic macromolecular matter with results from IOM extracted from meteorites and IDPs showed that the carbon structures we produced appear to be even more primitive. Comparison with previous laboratory experiments, especially Ferini et al. (2004), showed that their values for the G band were situated at even lower wavenumbers than those measured for the residues. These authors reported a shift toward higher wavenumbers of their G band with increasing radiation dose for the H2O: CH4: N2 ice when irradiated at 12 K, which structurally resembles the ice in our study. The authors attributed this effect to an increase in size or number of the largest sp2 clusters (Baratta et al. 1996). After warming up the residue and irradiating it again, however, they observed a shift of the G band position toward lower wavenumbers after the irradiation. This partially agrees with our findings because no consistent link between the change in G band position and high or low irradiation doses could be observed. It must be noted that the high and low irradiation doses were likely in the same order of magnitude for this work. To better study the effect of the electron irradiation dose and its effect on the Raman parameters compared to irradiation with ions or UV, future work should consider a low dose that is lower by an order of magnitude at least than the high dose. The differences in G band position between the laboratory analogs in this study and previous results, especially to the ices irradiated via energetic ions by Ferini et al. (2004), is interesting and warrants further study to investigate the effect of various energetic processes on the structure of the residues. A future study should therefore investigate the potential differences in Raman parameters resulting from particle or UV irradiation of identical ice mixtures as a starting point.
No G or D bands were observed for the singly irradiated samples, even though the dose was higher than the expected IOM-forming dose of 10s to 100s of eV/molecule (Ferini et al. 2004; Danger et al. 2022). This indicates that the SOMA formed in this first irradiation step does not yet resemble the macromolecular carbon structures probed with Raman spectroscopy. Therefore, additional analysis on these residues is of interest to compare the SOMA formed with electron irradiation to SOMA formed by VUV or ion irradiation (e.g. Danger et al. 2022, 2021) and to investigate whether the formed molecules differ fundamentally depending on the irradiation source at these high doses. The results by Ferini et al. (2004) indicated that the presence of hydrocarbons requires a lower dose than other carbon donors to efficiently form organic macromolecular matter when an ice is irradiated with ions. This might explain why no Raman signatures corresponding to organic macromolecular matter were observed after a single irradiation of the H2O: CH3OH: N2 ice. This needs to be investigated further, however, to determine whether the same conclusion can be drawn when using electrons compared to ions.
For the results shown in Section 3, the residues were always irradiated for a second time in an ice-free environment. One H2O: CH3OH: N2 ice (not shown) was irradiated for a second time at T2=100 K, which was below the H2O and CH3OH desorption temperature. This particular experiment resulted in no macromolecular residue, however. This might indicate that the molecules at 100 K were still volatile enough to desorb during the second irradiation or that the warm-up to at least 200 K is needed to form complex enough SOMA, which can then be further transformed into organic macromolecular matter during the second irradiation. This potential dependence on the presence of ice to form (or not form) organic macromolecular matter from SOMA should be investigated further. This effect would agree with findings by Alexander et al. (2007), who postulated that repeated irradiation in both ice-bearing and ice-free environments is needed to form refractory organics in the ISM, a similar process that might likely take place in the early stages of Solar System formation or evolution.
Furthermore, the results in Figure 7 indicate a dependence of the G band parameters on the first and second irradiation temperature, with the combination of T1=10 K and T2=300 K resulting in Raman signatures most like those measured by Busemann et al. (2009) for IDP IOM. This might indicate that the irradiation temperatures are indicative of the IOM formation history, but this has to be investigated with a broader parameter study. The small spread of the T1=10 K/T2=300 K G band parameters indicates, however, that the resulting residue is more uniform than the residues produced at other temperature combinations. The additional heating from 200 to 300 K might lead to additional chemical reactions and to further desorption of volatile organic molecules. This in turn means that the SOMA irradiated in the second step can have a drastically different chemical composition, which is reflected in the chemical outcome and its Raman signatures of this step. The study of the SOMA at 200 K and 300 K would therefore be valuable for investigating the potential formation pathways of organic macromolecular matter and for determining the molecules that might be available at a given temperature.
During the peak fitting, we observed that additional peaks may be considered to more accurately reproduce the complex spectra observed for the residues. When Raman spectra of carbonaceous material from meteorites or similar minor planetary bodies are analyzed, only the D and G bands are fit in general. It is not trivial to fit Raman data, however, and different fitting procedures were described in the literature, including the type of function used for the fitting, as well as the number of peaks used to fit the D and G bands, the standard of which might vary from field to field. Sadezky et al. (2005) used five peaks to fit Raman data, which were attributed to different carbon structures in the analyte. Homma et al. (2015) used four peaks and suggested that the increasing disorder of carbonaceous material causes the Raman bands to become more complex. Couturier-Tamburelli et al. (2024) even used up to eight bands to fit their Raman spectra of an irradiated benzene ice residue. However, adding more peaks increases the degeneracy of the parameters, and more care has to be taken to include the physical meaning of the peaks in the boundary conditions. This is further complicated by the fact that there is no definitive consensus on the physical meaning of the additional Raman bands.
The doses we used are in the order of 103 eV/molecule, which is higher than the doses used by other studies (e.g. Baratta et al. 2007; Danger et al. 2022). These doses might not be entirely unrealistic in protoplanetary disks, however: Ligterink et al. (2024) showed that in heavily irradiated zones in protoplanetary disk dust traps, an accumulated dose of over 1000 eV/molecule could be received by dust grains in a few decades. This results in enough energy to convert potential SOM into organic macromolecular matter. Furthermore, the outer layer of a comet is expected to experience irradiation of about 600 eV/molecule over its lifetime, which might also convert SOM into organic macromolecular matter and result in the cometary crust (Strazzulla & Johnson 1991). Nevertheless, lower doses and their effect on the residues should be investigated to help us to better constrain the potential formation history of organic macromolecular matter.
This pilot study has shown that electron irradiation can produce organic macromolecular matter with Raman characteristics resembling the insoluble organic matter found in IDPs. Future studies will investigate the parameter space of the dose and irradiation temperatures, and post-irradiation processing might be investigated for future experiments, as well as varying the initial ice composition. For example, exchanging the carbon-donor CH3OH for CH4 to study whether residues with similar measurable Raman properties form and to investigate the proposition by Ferini et al. (2004) that ices containing hydrocarbons need a lower irradiation dose to be converted into organic macromolecular matter. Furthermore, the dependence of ice-bearing or ice-free material during the second irradiation is of interest, as is whether a certain C/O ratio is required to form organic macromolecular matter under these conditions. Additionally, other components might also be added to the initial ice mixture, such as noble gases, to investigate their potential incorporation into the residue. This project would be of great interest to investigate the noble gas fractionation observed in the IOM of primitive meteorites (Busemann et al. 2000). Finally, the possibility of using high-resolution Raman spectra to possibly deconvolve carbon peaks in addition to the traditionally fit D and G band should be investigated.
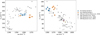 |
Fig. 9 D and G band parameters for a pre- and post-heated residue of an irradiated H2O: CH3OH: N2 ice. The data from Riebe et al. (2020) are plotted as well, where IOM was flash heated using a pyroprobe. A lighter color indicates heating to a higher temperature. The black triangle is unheated, and the other data points correspond to 400°C, 600°C, 800°C, and 1000°C. |
5 Conclusion
The initial results we obtained from the measurement campaign show promise in recreating organic macromolecular matter from the irradiation of simple ices using electrons. The comparison with IOM from meteorites and IDPs showed that an even more primitive form of organic matter is formed during the irradiation. The investigated residues were all derived from similar starting ices, and the main difference were the irradiation temperatures T1 and T2, and the dose received. No clear dependence on the doses was seen in the Raman parameters, but the temperature during the irradiation appeared to play a role. The sample for which a second irradiation at T2=300 K occurred was less widely spread in the G band position and in the ID/IG ratios than the other samples, as well as the best agreement with IOM extracted from IDPs, indicating a more uniform residue.
We added electrons as a potential irradiation source for the formation of organic macromolecular matter in the early Solar System or solar nebula, if it is derive from the processing of simple ices. This might indicate that secondary electrons drive the chemistry for the formation of IOM. Future studies can more closely examine the link between ice composition, irradiation, and the formation of macromolecules.
Acknowledgements
K.A.K. and N.F.W.L. acknowledge support from the Swiss National Science Foundation (SNSF) Ambizione grant 193453 and NCCR PlanetS. M.E.I.R. and N.M.A. acknowledge support from SNSF Ambizione grant 193331 and NCCR PlanetS.
Appendix A Raman Spectra
This section collects additional Raman spectra from the measured residues. Figures A.1, A.2, and A.3 show the baseline corrected Raman spectra of the samples 2, 3, and 4 respectively, which are then used for further analysis. HD corresponds to “High Dose” and LD to “Low Dose” respectively. Spectra indicated with “_a” were measured during a second visit to ETH.
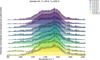 |
Fig. A.1 The Raman spectra of sample 2. |
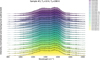 |
Fig. A.2 The Raman spectra of sample 3. |
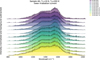 |
Fig. A.3 The Raman spectra of sample 4, which was irradiated at a lower irradiation current of 1 μA for roughly thrice the duration to achieve a similar dose to the other samples. |
References
- Abplanalp, M. J., Jones, B. M., & Kaiser, R. I., 2018, PCCP, 20, 5435 [Google Scholar]
- Alexander, C. M. O'D., Russell, S., Arden, J., et al. 1998, Meteor. Planet. Sci., 33, 603 [NASA ADS] [CrossRef] [Google Scholar]
- Alexander, C. M. O'D., Fogel, M., Yabuta, H., & Cody, G. 2007, Geochim. Cosmochim. Acta, 71, 4380 [NASA ADS] [CrossRef] [Google Scholar]
- Alexander, C. M. O'D., Cody, G., De Gregorio, B., Nittler, L., & Stroud, R. 2017, Geochemistry, 77, 227 [NASA ADS] [CrossRef] [Google Scholar]
- Allen, N. M., 2024, Raman data reduction, https://github.com/NicolaMAllen/raman-data-reduction, Accessed: 23.10.2024 [Google Scholar]
- Antunes, E., Lobo, A., Corat, E., et al. 2006, Carbon, 44, 2202 [Google Scholar]
- Arumainayagam, C., Garrod, R., Boyer, M., et al. 2019, Chem. Soc. Rev., 48 [Google Scholar]
- Atkins, P. W., 2006, Atkins' Physical Chemistry, 8th edn. (Oxford: Oxford University Press) [Google Scholar]
- Augé, B., Dartois, E., Engrand, C., et al. 2016, A&A, 592, A99 [NASA ADS] [CrossRef] [EDP Sciences] [Google Scholar]
- Baratta, G., Arena, M., Strazzulla, G., et al. 1996, Nucl. Instrum. Methods Phys. Res. B, 116, 195 [Google Scholar]
- Baratta, G., Leto, G., & Palumbo, M., 2002, A&A, 384, 343 [NASA ADS] [CrossRef] [EDP Sciences] [Google Scholar]
- Baratta, G., Brunetto, R., Caniglia, G., et al. 2007, Mem. Soc. Astron. It, 11, 185 [Google Scholar]
- Barnett, I., Lignell, A., & Gudipati, M., 2012, ApJ, 747, 13 [NASA ADS] [CrossRef] [Google Scholar]
- Bennett, C. J., & Kaiser, R. I., 2007, ApJ, 661, 899 [Google Scholar]
- Bockelée-Morvan, D., Biver, N., Moreno, R., et al. 2001, Science, 292, 1339 [NASA ADS] [CrossRef] [PubMed] [Google Scholar]
- Bonal, L., Quirico, E., Montagnac, G., et al. 2024, Icarus, 408, 115826 [Google Scholar]
- Bonnet, J.-Y., Quirico, E., Buch, A., et al. 2015, Icarus, 250, 53 [Google Scholar]
- Boogert, A. A., Gerakines, P. A., & Whittet, D. C., 2015, ARA&A, 53, 541 [NASA ADS] [CrossRef] [Google Scholar]
- Bouilloud, M., Fray, N., Bénilan, Y., et al. 2015, MNRAS, 451, 2145 [Google Scholar]
- Bradley, J., 2014, in Treatise on Geochemistry, 2nd edn., eds. H. D. Holland, & K. K. Turekian (Oxford: Elsevier), 287 [Google Scholar]
- Busemann, H., Baur, H., & Wieler, R., 2000, Meteor. Planet. Sci., 35, 949 [Google Scholar]
- Busemann, H., Alexander, M. O., & Nittler, L. R., 2007, Meteor. Planet. Sci., 42, 1387 [Google Scholar]
- Busemann, H., Young, A. F., Alexander, C. M. O., et al. 2006, Science, 312, 727 [NASA ADS] [CrossRef] [Google Scholar]
- Busemann, H., Nguyen, A. N., Cody, G. D., et al. 2009, Earth Planet. Sci. Lett., 288, 44 [Google Scholar]
- Callahan, M. P., Gerakines, P. A., Martin, M. G., Peeters, Z., & Hudson, R. L., 2013, Icarus, 226, 1201 [Google Scholar]
- Caro, G. M., Dartois, E., & Nakamura-Messenger, K., 2008, A&A, 485, 743 [NASA ADS] [CrossRef] [EDP Sciences] [Google Scholar]
- Carrillo-Sánchez, J. D., Nesvorný, D., Pokorný, P., Janches, D., & Plane, J. M. C., 2016, Geophys. Res. Lett., 43, 11979 [Google Scholar]
- Chan, Q. H., Franchi, I. A., Zhao, X., et al. 2020, Meteor. Planet. Sci., 55, 1320 [NASA ADS] [CrossRef] [Google Scholar]
- Charnley, S., & Rodgers, S. 2008, Space Sci. Rev., 138, 59 [NASA ADS] [CrossRef] [Google Scholar]
- Clemett, S. J., Maechling, C. R., Zare, R. N., Swan, P. D., & Walker, R. M., 1993, Science, 262, 721 [Google Scholar]
- Cooper, J. F., Johnson, R. E., Mauk, B. H., Garrett, H. B., & Gehrels, N., 2001, Icarus, 149, 133 [NASA ADS] [CrossRef] [Google Scholar]
- Couturier-Tamburelli, I., Danger, G., Mouzay, J., Pardanaud, C., & Piétri, N., 2024, J. Phys. Chem. A, 128, 636 [Google Scholar]
- Cruikshank, D. P., Roush, T. L., Owen, T. C., et al. 1993, Science, 261, 742 [NASA ADS] [CrossRef] [Google Scholar]
- Cruikshank, D. P., Imanaka, H., & Dalle Ore, C. M., 2005, Adv. Space Res., 36, 178 [Google Scholar]
- Danger, G., Vinogradoff, V., Matzka, M., et al. 2021, Nat. Commun., 12, 3538 [Google Scholar]
- Danger, G., Ruf, A., Javelle, T., et al. 2022, A&A, 667, A120 [NASA ADS] [CrossRef] [EDP Sciences] [Google Scholar]
- Davidsson, B. J. R., 2021, MNRAS, 505, 5654 [NASA ADS] [CrossRef] [Google Scholar]
- de Marcellus, P., Fresneau, A., Brunetto, R., et al. 2017, MNRAS, 464, 114 [NASA ADS] [CrossRef] [Google Scholar]
- Derenne, S., & Robert, F., 2010, Meteor. Planet. Sci., 45, 1461 [NASA ADS] [CrossRef] [Google Scholar]
- Drouin, D., Couture, A. R., Joly, D., et al. 2007, Scanning, 29, 92 [CrossRef] [PubMed] [Google Scholar]
- Duprat, J., Dobrică, E., Engrand, C., et al. 2010, Science, 328, 742 [NASA ADS] [CrossRef] [Google Scholar]
- Ehrenfreund, P., & van Dishoeck, E., 1998, Adv. Space Res., 21, 15 [Google Scholar]
- Ehrenfreund, P., & Charnley, S. B., 2000, ARA&A, 38, 427 [Google Scholar]
- Fayolle, E. C., Balfe, J., Loomis, R., et al. 2016, ApJ, 816, L28 [Google Scholar]
- Ferini, G., Baratta, G., & Palumbo, M., 2004, A&A, 414, 757 [NASA ADS] [CrossRef] [EDP Sciences] [Google Scholar]
- Ferrari, A. C., & Robertson, J., 2000, Phys. Rev. B, 61, 14095 [Google Scholar]
- Flynn, G., Keller, L., Wirick, S., & Jacobsen, C., 2008, Proc. Int. Astron. Union, 4, 267 [Google Scholar]
- Fraundorf, P., McKeegan, K., Sandford, S., Swan, P., & Walker, R., 1982, J. Geophys. Res.: Solid Earth, 87, A403 [Google Scholar]
- Fray, N., Bardyn, A., Cottin, H., et al. 2016, Nature, 538, 72 [CrossRef] [Google Scholar]
- Fray, N., Bardyn, A., Cottin, H., et al. 2017, MNRAS, 469, S506 [NASA ADS] [CrossRef] [Google Scholar]
- Förstel, M., Maksyutenko, P., Jones, B. M., et al. 2016, Chem. Commun., 52, 741 [CrossRef] [Google Scholar]
- Gilmour, I., 2003, in Treatise on Geochemistry, eds. H. D. Holland, & K. K. Turekian (Oxford: Pergamon), 269 [Google Scholar]
- Glavin, D. P., Alexander, C. M., Aponte, J. C., et al. 2018, in Primitive Meteorites and Asteroids, ed. N. Abreu (Elsevier), 205 [Google Scholar]
- Hayatsu, R., Winans, R. E., Scott, R. G., et al. 1980, Science, 207, 1202 [Google Scholar]
- Herbst, E., & van Dishoeck, E. F., 2009, Annu. Rev. Astron. Astrophys., 47, 427 [Google Scholar]
- Hiura, H., Ebbesen, T., Tanigaki, K., & Takahashi, H., 1993, Chem. Phys. Lett., 202, 509 [Google Scholar]
- Holtom, P., Bennett, C., Osamura, Y., Mason, N., & Kaiser, R., 2005, ApJ, 626, 940 [Google Scholar]
- Homma, Y., Kouketsu, Y., Kagi, H., Mikouchi, T., & Yabuta, H., 2015, J. Mineral. Petrol. Sci., 110, 276 [Google Scholar]
- Jakubek, R. S., & Fries, M. D., 2023, Earth Space Sci., 10, e2022EA002724 [Google Scholar]
- Jones, B. M., Kaiser, R. I., & Strazzulla, G., 2014, ApJ, 781, 85 [Google Scholar]
- Kim, Y. S., & Kaiser, R. I., 2012, ApJ, 758, 37 [Google Scholar]
- Kipfer, K. A., Galli, A., Riedo, A., et al. 2024, Icarus, 410, 115742 [NASA ADS] [CrossRef] [Google Scholar]
- Kuga, M., Marty, B., Marrocchi, Y., & Tissandier, L., 2015, PNAS, 112, 7129 [NASA ADS] [CrossRef] [Google Scholar]
- Ligterink, N. F. W., Terwisscha van Scheltinga, J., Taquet, V., et al. 2018, MNRAS, 480, 3628 [Google Scholar]
- Ligterink, N. F., Pinilla, P., van der Marel, N., et al. 2024, Nat. Astron., 8, 1257 [Google Scholar]
- Llorca, J., 2004, Int. Microbiol., 7, 239 [Google Scholar]
- Lorenzi, V., Pinilla-Alonso, N., & Licandro, J., 2015, A&A, 577, A86 [NASA ADS] [CrossRef] [EDP Sciences] [Google Scholar]
- Marks, J. H., Wang, J., Fortenberry, R. C., & Kaiser, R. I., 2022, PNAS, 119, e2217329119 [Google Scholar]
- Mathurin, J., Bejach, L., Dartois, E., et al. 2024, A&A, 684, A198 [NASA ADS] [CrossRef] [EDP Sciences] [Google Scholar]
- McClure, M. K., Rocha, W., Pontoppidan, K., et al. 2023, Nat. Astron., 7, 431 [NASA ADS] [CrossRef] [Google Scholar]
- Mennella, V., Palumbo, M. E., & Baratta, G. A., 2004, ApJ, 615, 1073 [NASA ADS] [CrossRef] [Google Scholar]
- Messenger, S., 2000, Nature, 404, 968 [CrossRef] [PubMed] [Google Scholar]
- Morgan, W. A. Jr, Feigelson, E. D., Wang, H., & Frenklach, M., 1991, Science, 252, 109 [Google Scholar]
- Mullie, F., & Reisse, J., 1987, in Organic Geo- and Cosmochemistry, 83 [Google Scholar]
- Muñoz Caro, G. M., Matrajt, G., Dartois, E., et al. 2006, A&A, 459, 147 [NASA ADS] [CrossRef] [EDP Sciences] [Google Scholar]
- Muñoz Caro, G. M., Dartois, E., Boduch, P., et al. 2014, A&A, 566, A93 [NASA ADS] [CrossRef] [EDP Sciences] [Google Scholar]
- Nesvorný, D., Jenniskens, P., Levison, H. F., et al. 2010, ApJ, 713, 816 [CrossRef] [Google Scholar]
- Nuevo, M., Milam, S., Sandford, S., et al. 2011, Adv. Space Res., 48, 1126 [NASA ADS] [CrossRef] [Google Scholar]
- Owen, T. C., Roush, T. L., Cruikshank, D. P., et al. 1993, Science, 261, 745 [NASA ADS] [CrossRef] [Google Scholar]
- Peltzer, E., Bada, J., Schlesinger, G., & Miller, S., 1984, Adv. Space Res., 4, 69 [NASA ADS] [CrossRef] [Google Scholar]
- Pizzarello, S., 2007, Origins Life Evol. Biospheres, 37, 341 [NASA ADS] [CrossRef] [Google Scholar]
- Pizzarello, S., Cooper, G., & Flynn, G., 2006, Meteor. Early Solar Syst. II, 1, 625 [Google Scholar]
- Potiszil, C., Montgomery, W., & Sephton, M. A., 2021, Earth Planet. Sci. Lett., 574, 117149 [Google Scholar]
- Quirico, E., Raynal, P.-I., & Bourot-Denise, M., 2003, Meteor. Planet. Sci., 38, 795 [Google Scholar]
- Quirico, E., Orthous-Daunay, F.-R., Beck, P., et al. 2014, Geochim. Cosmochim. Acta, 136, 80 [Google Scholar]
- Quirico, E., Bonal, L., Beck, P., et al. 2018, Geochim. Cosmochim. Acta, 241, 17 [CrossRef] [Google Scholar]
- Raulin, F., 2008, in Strategies of Life Detection, 37 [Google Scholar]
- Remusat, L., Robert, F., & Derenne, S., 2007, Comp. Rend. Geosci., 339, 895 [Google Scholar]
- Riebe, M. E., Foustoukos, D., Alexander, C. M. O., et al. 2020, Earth Planet. Sci. Lett., 540, 116266 [Google Scholar]
- Robert, F., & Epstein, S., 1982, Geochim. Cosmochim. Acta, 46, 81 [CrossRef] [Google Scholar]
- Rouillé, G., Millot, G., Saint-Loup, R., & Berger, H., 1992, J. Mol. Spectrosc., 154, 372 [Google Scholar]
- Rubin, M., Altwegg, K., Balsiger, H., et al. 2015, Science, 348, 232 [NASA ADS] [CrossRef] [Google Scholar]
- Sadezky, A., Muckenhuber, H., Grothe, H., Niessner, R., & Pöschl, U., 2005, Carbon, 43, 1731 [Google Scholar]
- Schmitt-Kopplin, P., Gabelica, Z., Gougeon, R. D., et al. 2010, PNAS, 107, 2763 [CrossRef] [Google Scholar]
- Sephton, M. A., 2002, Natural Product Rep., 19, 292 [NASA ADS] [CrossRef] [Google Scholar]
- Sephton, M. A., & Botta, O., 2005, Int. J. Astrobiol., 4, 269 [Google Scholar]
- Strazzulla, G., Baratta, G. A., Johnson, R. E., & Donn, B., 1991, Icarus, 91, 101 [Google Scholar]
- Strazzulla, G., & Johnson, R. E., 1991, in Comets in the Post-Halley Era., eds. R. Newburn, M. Neugebauer, & J. Rahe (Springer Netherlands) 243 [Google Scholar]
- Strazzulla, G., Baratta, G. A., Leto, G., & Foti, G., 1992, Europhys. Lett., 18, 517 [NASA ADS] [CrossRef] [Google Scholar]
- Tegler, S. C., Grundy, W. M., Romanishin, W., et al. 2007, AJ, 133, 526 [Google Scholar]
- Thomas, K. L., Keller, L. P., Blanford, G. E., & McKay, D. S., 1994, in Analysis of Interplanetary Dust Particles [Google Scholar]
- Vinogradoff, V., Le Guillou, C., Bernard, S., et al. 2017, Geochim. Cosmochim. Acta, 212, 234 [NASA ADS] [CrossRef] [Google Scholar]
- Wopenka, B., 1988, Earth Planet. Sci. Lett., 88, 221 [Google Scholar]
- Yamamoto, S., 2017, Introduction to Astrochemistry: Chemical Evolution from Interstellar Clouds to Star and Planet Formation, Astronomy and Astrophysics Library (Springer Japan) [Google Scholar]
- Zhang, C., Leyva, V., Wang, J., et al. 2024, PNAS, 121, e2320215121 [Google Scholar]
- Zhou, L., Maity, S., Abplanalp, M., Turner, A., & Kaiser, R. I., 2014, ApJ, 790, 38 [Google Scholar]
All Tables
Overview of the irradiation experiments performed on a H2O:CH3OH:N2(5:5:1) ice and resulting SOMA.
All Figures
|
Fig. 1 (A) ICEBEAR setup. (B) EQ 22/35 electron gun mounted on top of the chamber. (C) Example of the irradiated spots on the aluminum foil after the foil was removed from the chamber. |
| In the text | |
|
Fig. 2 Schematic illustration of the measurement principle. First, the H2O:CH3OH:N2 ice is irradiated at low temperatures T1 at a current I1 for a time t1, which leads to the formation of a soluble organic matter analog. The sample is then heated above the water sublimation temperature to a temperature T2 and irradiated at a current I2 for a second time t2, resulting in the formation of organic macromolecular matter from the soluble organic matter analog. The aluminum foil is not displayed in the schematic. The schematic is adapted in part from Danger et al. (2022). |
| In the text | |
|
Fig. 3 Raman spectra of the residues of sample 1, singly irradiated (left), and doubly irradiated at the high dose (right). The spectra were not baseline corrected to show the shape of the background. The left panel shows a prominent fluorescence signal. In the right panel, the D band is visible at around 1360 cm−1, and the G band can be observed at around 1560 cm−1. |
| In the text | |
|
Fig. 4 Raman spectra of different spots from sample 1. HD indicates that the residue has received a high dose, and LD indicates a low dose. The D band is visible at around 1360 cm−1, and the G band can generally be observed at around 1560 cm−1. |
| In the text | |
|
Fig. 5 Amplitudes of the Lorentzian fit for the D and G band (left) as well as the ratio of the peak amplitudes ID/IG (right). For the ratios, a we show a boxplot with the minimum, maximum, and the first and third quartile of the values as edges of the box. The orange line represents the median, and the green line shows the mean of the values. The spot measured for sample 4 falling outside of the range is considered an outlier. |
| In the text | |
|
Fig. 6 Full width at half maximum Γ of the D and G band as a function of the peak center ω for the different samples investigated with the Raman spectrometer. The samples are colored based on the dose. The semitransparent marker indicates that the Raman spectrum was measured on what might be considered the rim of the sample. |
| In the text | |
|
Fig. 7 G band peak position and FWHM as a function of the irradiation temperatures. |
| In the text | |
|
Fig. 8 G band parameters compared to Raman data in the literature, including previous laboratory measurements and Raman measurements from meteoritic and IDP IOM. The meteoritic IOM data comes from Busemann et al. (2007); Quirico et al. (2018); Potiszil et al. (2021), the IDP data from Davidsson (2021); Busemann et al. (2009); Chan et al. (2020); Ferini et al. (2004); Caro et al. (2008) and the laboratory data from Baratta et al. (1996); Mennella et al. (2004); Ferini et al. (2004); Bonnet et al. (2015); Couturier-Tamburelli et al. (2024). |
| In the text | |
|
Fig. 9 D and G band parameters for a pre- and post-heated residue of an irradiated H2O: CH3OH: N2 ice. The data from Riebe et al. (2020) are plotted as well, where IOM was flash heated using a pyroprobe. A lighter color indicates heating to a higher temperature. The black triangle is unheated, and the other data points correspond to 400°C, 600°C, 800°C, and 1000°C. |
| In the text | |
|
Fig. A.1 The Raman spectra of sample 2. |
| In the text | |
|
Fig. A.2 The Raman spectra of sample 3. |
| In the text | |
|
Fig. A.3 The Raman spectra of sample 4, which was irradiated at a lower irradiation current of 1 μA for roughly thrice the duration to achieve a similar dose to the other samples. |
| In the text | |
Current usage metrics show cumulative count of Article Views (full-text article views including HTML views, PDF and ePub downloads, according to the available data) and Abstracts Views on Vision4Press platform.
Data correspond to usage on the plateform after 2015. The current usage metrics is available 48-96 hours after online publication and is updated daily on week days.
Initial download of the metrics may take a while.